Unemployment during the pandemic: How to avoid going for broke
Key takeaways.
- Without significant policy changes, employers will be hit with hefty tax increases to pay for mounting unemployment insurance (UI) claims.
- Thinning tax bases make financing UI more challenging.
- Having state UI trust funds in the red may make it much harder for job markets to recover.
Since the onset of the COVID-19 pandemic in late February, tens of millions of Americans have lost their jobs. Anxiety among many employers and consumers is still high — suggesting little hope of a rapid recovery.
This leaves state and local governments with gaping budget shortfalls amid falling income and sales tax revenues while demand for public services rises. A particularly fast-growing area of state expenditure is the payment of unemployment insurance (UI) benefits.
There has been extensive discussion among policymakers and the media regarding the trade-offs of more generous or longer-lasting UI benefits, such as the federal government’s provision of an additional $600 per week that expired July 31. But there has been very little talk about the tax hikes they will incur.
Many states have depleted their UI trust funds in the current crisis and have started to borrow from the federal government to pay their residents’ UI benefits. In the absence of additional policy changes, employers will be hit with significant UI tax increases over the next few years. And that will likely prevent some of the jobs that were lost from coming back.
In this policy brief, we explain how state unemployment insurance programs are financed and the threats to their solvency. We also discuss two reforms: one to relieve employers faced with crippling payroll tax increases in the coming years, and another to ensure that state UI trusts have enough money for future payouts.

Understanding unemployment insurance
Unemployment insurance is one of the largest social insurance programs in the United States, with each state running its own UI program to pay benefits to people laid off from their jobs. In most states, UI replaces about half of a worker’s earnings up to a weekly benefit maximum ($443 in the median state) for a maximum of 26 weeks (6 months).
While providing a needed cushion to workers, UI leaves policymakers with a difficult balancing act. As benefits become more generous, many recipients reduce their efforts to find and maintain jobs, reducing total income and burdening other workers (Johnston and Mas 2018). But if benefits become stingier, the cushion provides less support leaving some unemployed vulnerable to fall behind on their bills or lose their housing (Ganong and Noel 2019). [1]
Benefits are generally paid to people with relatively low saving rates, so the money that is distributed is quickly spent, providing short-term stimulus for consumer goods. This leads economists to refer to UI as an “automatic stabilizer.” Without the need for additional legislation, states automatically spend more money on unemployment benefits when economic conditions deteriorate, and spending naturally retracts as the economy recovers.
During the strong labor market leading up to the pandemic, just 220,000 workers filed new UI claims in the typical week. In late February, the unemployment rate was at 3.5 percent — a 60-year low — and about 1.7 million Americans were receiving UI benefits.
But two months later, the pandemic’s sudden and massive shock to the economy vaulted the U.S. unemployment rate to 14.7 percent — an 80-year-high. This April, rates varied substantially across states, from a high of 28.2 percent in Nevada to a low of 8.3 percent in Nebraska.
During the last week of March, 6.9 million Americans filed new claims for UI benefits. As demonstrated in Figure 1, this was 10 times higher than the corresponding peak in new UI claims during the depths of the Great Recession more than a decade ago. By early May of this year, more than 25 million Americans were receiving UI payments and in every week since early March, new UI claims have exceeded the Great Recession peak of 660,000.
Figure 1: Weekly Initial Unemployment Insurance Claims (Thousands)

From March through the end of July, the federal CARES (Coronavirus Aid, Relief, and Economic Security) Act increased unemployment benefits for each recipient by $600 per week. That meant the average UI recipient was paid one-third more in unemployment than she earned while working (Ganong et al. 2020).
This raised concerns that workers had little incentive to return to work or find a new job, a condition necessary for labor market restructuring and recovery. [2] This additional UI funding expired at the end of July after lawmakers were unable to agree on another round of federal spending. President Trump attempted to provide a $300-dollar weekly “top-up” by executive order (with states given the option to provide an additional $100). Whether and when that happens is unclear given that states have to apply for the funding. [3]
UI benefits are financed by a payroll tax on employers. Unlike other taxes, UI tax rates are “experience-rated,” which means that an employer’s future tax rate rises if its employees claim UI benefits, and its tax rate falls when the firm avoids layoffs. This gives employers a strong incentive to balance the demand for layoffs with the cost that they impose on the UI system.
One consequence of experience-rating UI taxes is that tax rates increase as the economy begins to recover from recession. This significantly raises the cost of hiring new workers or retaining old ones, likely weighing down recovery of the labor market.
As shown in Figure 2, the average UI tax rate increased by more than 50 percent from 2009 to 2012 as the recovery was haltingly underway. This increase was especially high in middle-class industries — like construction and manufacturing — that were hit hardest during the Great Recession. As this same figure shows, average tax rates were more than 2.5 times as high among employers in construction as among all employers in the years following the three most recent recessions.
Figure 2: Average UI Tax Rate on Total Wages (1990-2018)

Surviving firms have to cover the UI costs generated by the employers that went out of business — causing them to be doubly burdened. Given the much larger increase in UI claims during the current recession relative to previous ones and the likely greater rate of firm exit, the increase in UI taxes could be substantially higher over the next few years than in the years following the Great Recession. This will encourage outsourcing and automation, induce some firms to shut down, and impede employment.
Softening the blow to businesses
Unless employment recovers with impressive speed, each claim will draw an average of $7,000 in payments from state UI trust funds. Those payments will transform into an estimated $270 billion dollars in payroll tax increases on firms over the next few years, reducing the ability of firms to resume normal hiring and employment and further stalling a labor market comeback. [4]
In March and April of this year, 20 states suspended experience rating to shield their employers from an avalanche of additional UI taxes in the upcoming years. These states span the political spectrum as well as geography, including Arizona, Georgia, Idaho, Maine, Maryland, Ohio, Texas, and Washington. [5]
While this policy change will — all else equal — hasten the labor market recovery in these states, it may also lead to a substantial increase in layoffs since it removes firms’ financial incentives to retain workers. Consistent with this, a comparison of five states that suspended experience rating with five neighboring states that did not reveals that layoff rates (defined as new UI claims divided by the workforce) were 30 percent higher in the five that shut down experience rating. [6]
States are therefore in a bind. By maintaining experience rating, a wave of future tax increases may hamper the economic recovery and prolong unemployment. But suspending experience rating may induce additional layoffs today, when things are most dire.
To soften the blow over the next few years while maintaining the incentives for employers to retain their workforce, states could adjust each company’s UI costs so that they are temporarily evaluated based on conditions in their industry — reducing the scope for tax increases that were out of the firm’s control.
For the next few years, employers would essentially be graded on a curve, comparing their layoff history with industry peers rather than a non-existent perfect firm. For example, since restaurants have been hit especially hard during the pandemic while the average technology firm has thrived, a restaurant that laid off 10 percent of its workers would face a smaller tax increase than a computer software company that did the same. Employers would have essentially equal incentives to maintain their workforce, but would not face crushing tax increases if they happen to be in an industry that was differentially hit by the COVID pandemic and the resulting lockdowns.
The benefits of such a policy could be substantial. Research suggests that employment is highly sensitive to UI tax increases in part because they hit firms that are already on the proverbial ropes. Anderson and Meyer (1997) find that a 1 percent increase in costs from UI taxes reduces employment by 2 percent. More recent research by Johnston (2020) finds even larger effects.
Shoring up the trust funds
The pandemic has shed light on the vulnerability of UI financing. Better maintenance of UI trust funds is vital to prepare states for the next economic downturn and improve prospects for future recoveries.
There is a large and growing gap in UI tax costs across jurisdictions. States like California and Florida have a low maximum tax rate and an annual tax base of around $7,000 — the lowest allowed by federal law — resulting in maximum potential UI taxes of about $400 per worker. In contrast, states like Washington and Oregon maintain large tax bases ($52,700 and $42,100, respectively) resulting in potential UI taxes of more than $2,000 per worker. [7]
In good times, states store revenues from UI taxes in a trust fund and that fund is drawn down in the depth of recessions. In recent years, however, state trust funds have been low even in good times — a function of benefits that are more generous than their financing (von Wachter 2016). The Department of Labor’s 2020 Solvency Report shows that despite a 10-year economic expansion, 21 state UI trust funds were below the minimum recommended reserve, just prior to the pandemic (U.S. Department of Labor 2020). [8] As of August 2020, 11 states have already depleted their UI trust funds and have started to receive loans from the federal government to pay UI benefits. [9]
These deficits may contribute to lethargic recoveries. When trust funds are low, states must steeply raise rates to recover their costs and pay benefits. The timing of these increases could not be worse. Weak trust funds also undermine experience rating. When a state trust fund is in debt to the federal government, federal UI taxes rise on all firms in that state until the federal loan is repaid, regardless of the firm’s layoffs.
In California, for instance, the large loan balance accrued during the 2008 recession was not repaid in full until 2018, hiking payroll taxes for employers across the board. This weakens the intended incentives of experience rating to encourage employment stability and curb abuse of the UI system. According to the same Labor Department Solvency Report cited above, California’s UI trust fund was in the worst position of all 50 states just prior to the pandemic (Appendix Figure 1). [10]
The thinning tax base is a leading cause of low UI reserves. States choose how much of a worker’s earnings are exposed to UI taxation, but the federal government can “update” the minimum requirement to keep pace with inflation and the rise in average earnings. The current federal requirement of $7,000 has —remarkably — not been updated since 1982, eroding the tax base unless states have legislated increases or proactively linked their taxable UI earnings base to inflation or wage growth.
Another important consequence of a small tax base is that UI taxes become much more regressive. This can reduce the employment opportunities for part-time workers or those with low earnings since firms essentially pay an equal tax for each worker (Guo and Johnston 2020). In a state like California, an employer would pay the same UI tax for a worker who earned $8,000 annually as for one who earned $40,000.
But the latter worker is eligible for a weekly UI benefit that is five times larger ($400 per week versus just $80 per week for the lower-paid worker). Expanding the UI program’s taxable wage base in states like California would reduce the implicit penalty on hiring low-wage earners (principally seasonal and part-time workers as well as students).
To restore the health of UI trust funds, governments should expand their tax bases to be proportional to the level of benefits in their state. A basic reform to shore up trust funds could be to require states to have taxable wage bases at least half as large as their annual insurable earnings.
Figure 3 plots the ratio of insured wages to taxable wages across the country, with larger values indicating greater insurance than funding.
Figure 3: Ratio of Annual Insured Wages to Taxable Wages (2015)

In California the UI-insurable income is $47,000, more than six times greater than the tax base of only $7,000. This reform would naturally link revenues to the generosity of the state’s UI system, allow states to lower tax rates, and bring in sufficient revenues to cushion workers the next time there is an economic shock. Harmonizing tax bases across states would also reduce the incentive for multi-state firms to reallocate jobs and operations based on state UI tax differences (Guo 2020).
Time for action
The COVID-19 crisis has put unemployment insurance at center stage of American politics and economic policy. It has provided a lifeline for tens of millions of workers who have lost their jobs since the pandemic’s onset six months ago, while at the same time exposing the system’s vulnerabilities. Given the complexity of UI financing and the scarcity of empirical evidence on which to rely, this is an important area for additional work and exploration.
Unless policymakers take steps to reform how the states’ unemployment insurance trust funds are financed, tax hikes will hurt labor market recoveries across the country — and with them, the American worker.
Mark Duggan is the Trione Director of SIEPR and the Wayne and Jodi Cooperman Professor of Economics at Stanford. Audrey Guo is an assistant professor of economics at Santa Clara University’s Leavey School of Business. Andrew C. Johnston is an assistant professor of economics, as well as applied econometrics at the University of California at Merced.
The authors are grateful to Isaac Sorkin for his helpful feedback.
1 States differ in where they choose to fall on that trade-off. The maximum weekly benefit varies substantially across states, from a low of $235 in Mississippi to a high of $790 in Washington. Some states also have a maximum duration of less than 26 weeks.
2 Recent research suggests that, at least in the short term, the disincentive effects of the increases in UI benefits (caused by the CARES Act) were minimal (Altonji et al. 2020).
3 More than half of states had applied or signaled their intention to apply as of August 21. Only South Dakota announced that it would not be applying (Iacurci 2020). States that are approved are guaranteed just three weeks of federal funding for the enhanced UI benefits, though more federal funding may be available.
4 For this calculation, we extrapolate weekly UI claims through the end of the year and assume that half of those claims become benefit spells. We use data on average weekly benefit amounts and average UI spell durations to calculate the typical cost of a UI benefit spell at a little over $7,000. The product of these two values is an estimate of the UI benefit costs that will factor into UI taxes over the coming years. The actual average value could be substantially higher if the recovery is slow, as this would lead to longer and more costly average UI benefit periods.
5 These 20 states are Alabama, Arizona, Georgia, Idaho, Iowa, Louisiana, Maine, Maryland, Minnesota, Missouri, Montana, Nebraska, North Carolina, North Dakota, Ohio, Pennsylvania, South Carolina, Texas, Utah, Washington, and the District of Columbia.
6 The matched pairs are — with the states that suspended experience rating listed first — Alabama and Mississippi, Ohio and Indiana, North Dakota and South Dakota, Arizona and New Mexico, and Idaho and Oregon.
7 Appendix Table 1 lists the UI tax base in each state in 2020 along with each state’s maximum per-worker tax and maximum weekly UI benefit.
8 The Department of Labor recommends that states have reserves in their trust funds that are at least as large as the highest recent years of UI benefit payout.
9 As of August 25, 2020, 11 states have borrowed $24.4 billion from the federal unemployment account. California, New York, and Texas account for 82% of that borrowing .
10 As shown in Appendix Figure 1, California’s solvency ratio of 0.21 was lower than the other 49 states, the District of Columbia, and Puerto Rico.
Altonji, Joseph, Zara Contractor, Lucas Finamor, Ryan Haygood, Ilse Lindenlaub, Costas Meghir, Cormac O’Dea, Dana Scott, Liana Wang, and Ebonya Washington. “Employment Effects of Unemployment Insurance Generosity during the Pandemic.” Working Paper (2020).
Anderson, Patricia M., and Bruce D. Meyer. "The effects of firm specific taxes and government mandates with an application to the U.S. unemployment insurance program." Journal of Public Economics 65, no. 2 (1997): 119-145.
Ganong, Peter, and Pascal Noel. "Consumer spending during unemployment: Positive and normative implications." American Economic Review 109, no. 7 (2019): 2383-2424.
Ganong, Peter, Pascal Noel, and Joseph S. Vavra. U.S. Unemployment Insurance Replacement Rates During the Pandemic , no. w27216. National Bureau of Economic Research (2020).
Guo, Audrey. "The effects of unemployment insurance taxation on multi-establishment firms." Working Paper (2020).
Guo, Audrey, and Andrew C. Johnston. "The Finance of Unemployment Compensation and its Consequence for the Labor Market." Working Paper (2020).
Iacurci, Greg. “ This Map Shows Where States Stand on the Extra $300 Weekly Unemployment Benefits. ” CNBC, August 21, 2020.
Johnston, Andrew C. “Unemployment Insurance Taxes and Labor Demand: Quasi-experimental Evidence from Administrative Data.” Forthcoming at American Economic Journal: Economic Policy (2020).
Johnston, Andrew C., and Alexandre Mas. "Potential unemployment insurance duration and labor supply: The individual and market-level response to a benefit cut." Journal of Political Economy 126, no. 6 (2018): 2480-2522.
U.S. Department of Labor. State Unemployment Insurance Trust Fund Solvency Report 2020. February 2020.
Von Wachter, Till. “ Unemployment Insurance Reform: A Primer. ” Washington Center for Equitable Growth. October 2016.
Appendix Table A
| State | Max Weekly Benefit* | Taxable Wage Base | Max Per-Worker Tax |
|---|---|---|---|
| Alabama | 265 | 8,000 | 544 |
| Alaska | 370 | 39,900 | 2,354 |
| Arizona | 240 | 7,000 | 826 |
| Arkansas | 451 | 10,000 | 600 |
| California | 450 | 7,000 | 434 |
| Colorado | 597 | 13,100 | 1,068 |
| Connecticut | 631 | 15,000 | 810 |
| Delaware | 330 | 16,500 | 1,320 |
| District of Columbia | 438 | 9,000 | 630 |
| Florida | 275 | 7,000 | 378 |
| Georgia | 330 | 9,500 | 770 |
| Hawaii | 630 | 46,800 | 2,621 |
| Idaho | 414 | 40,000 | 2,160 |
| Illinois | 471 | 12,960 | 892 |
| Indiana | 390 | 9,500 | 703 |
| Iowa | 467 | 30,600 | 2,295 |
| Kansas | 474 | 14,000 | 994 |
| Kentucky | 502 | 10,500 | 945 |
| Louisiana | 221 | 7,700 | 462 |
| Maine | 431 | 12,000 | 648 |
| Maryland | 430 | 8,500 | 638 |
| Massachusetts | 795 | 15,000 | 2,156 |
| Michigan | 362 | 9,000 | 567 |
| Minnesota | 717 | 34,000 | 3,060 |
| Mississippi | 235 | 14,000 | 756 |
| Missouri | 320 | 12,000 | 648 |
| Montana | 527 | 33,000 | 2,020 |
| Nebraska | 426 | 9,000 | 486 |
| Nevada | 450 | 31,200 | 1,685 |
| New Hampshire | 427 | 14,000 | 1,050 |
| New Jersey | 696 | 34,400 | 1,858 |
| New Mexico | 442 | 24,800 | 1,339 |
| New York | 450 | 11,400 | 832 |
| North Carolina | 350 | 24,300 | 1,400 |
| North Dakota | 595 | 36,400 | 3,549 |
| Ohio | 443 | 9,500 | 874 |
| Oklahoma | 520 | 18,100 | 996 |
| Oregon | 624 | 40,600 | 2,192 |
| Pennsylvania | 561 | 10,000 | 1,103 |
| Rhode Island | 566 | 23,600 | 2,289 |
| South Carolina | 326 | 14,000 | 756 |
| South Dakota | 402 | 15,000 | 1,403 |
| Tennessee | 275 | 7,000 | 700 |
| Texas | 507 | 9,000 | 540 |
| Utah | 560 | 35,300 | 2,471 |
| Vermont | 498 | 15,600 | 1,014 |
| Virginia | 378 | 8,000 | 480 |
| Washington | 749 | 49,800 | 2,689 |
| West Virginia | 424 | 12,000 | 900 |
| Wisconsin | 370 | 14,000 | 1,498 |
| Wyoming | 489 | 25,400 | 2,159 |
Source: US Dept of Labor Significant Provisions of State Unemployment Insurance Laws 2019
*For single workers. Some states offer additional dependent allowances
Appendix Figure 1 - State UI Trust Fund Solvency (as of 1/1/2020)

Source: U.S. Department of Labor Trust Fund Solvency Report 2020
Related Topics
- Policy Brief
More Publications
Identification and inference in nonlinear difference-in-differences models, lower oil price volatility for a smooth transition to a green energy future, a framework for geoeconomics.
Numbers, Facts and Trends Shaping Your World
Read our research on:
Full Topic List
Regions & Countries
- Publications
- Our Methods
- Short Reads
- Tools & Resources
Read Our Research On:
Unemployment rose higher in three months of COVID-19 than it did in two years of the Great Recession

The COVID-19 outbreak and the economic downturn it engendered swelled the ranks of unemployed Americans by more than 14 million, from 6.2 million in February to 20.5 million in May 2020. As a result, the U.S. unemployment rate shot up from 3.8% in February – among the lowest on record in the post-World War II era – to 13.0% in May. That rate was the era’s second highest, trailing only the level reached in April (14.4%).
The rise in the number of unemployed workers due to COVID-19 is substantially greater than the increase due to the Great Recession, when the number unemployed increased by 8.8 million from the end of 2007 to the beginning of 2010. The Great Recession, which officially lasted from December 2007 to June 2009, pushed the unemployment rate to a peak of 10.6% in January 2010, considerably less than the rate currently, according to a new Pew Research Center analysis of government data.
How we did this
The COVID-19 recession, barely three months old, has had a sharp and severe impact on unemployment among American workers. This report focuses on how the recession has affected unemployment among major demographic groups of workers. The key indicator analyzed is the unemployment rate, which is the number of workers actively seeking work – the unemployed – as a share of workers either at work or actively seeking work – the labor force.
Most estimates of the unemployment rate in this report are from the U.S. Bureau of Labor Statistics, based on its survey of households, the Current Population Survey (CPS). The CPS is the government’s official source for monthly estimates of unemployment. Additional estimates, specifically those for racial, ethnic and nativity groups in the Great Recession, are based on the analysis of CPS data by Pew Research Center. Most estimates for the Great Recession period are adjusted to account for the effects of annual revisions to the CPS . All estimates are nonseasonally adjusted because seasonal adjustment factors are not available for many of the demographic groups included in this report.
The COVID-19 outbreak has affected data collection efforts by the U.S. government in its surveys, especially limiting in-person data collection. This resulted in about a 10 percentage point decrease in the response rate for the CPS in March and April 2020 and an even greater decrease in May 2020. It is possible that some measures of unemployment and its demographic composition are affected by these changes in data collection.
The unemployment rate in May might have been as high as 16%, by the U.S. government’s estimate. But it is not recorded as such because of measurement challenges that have arisen amid the coronavirus outbreak. Also, a sharp decline in labor force participation among U.S. workers overall may be adding to the understatement of unemployment. In May, 9 million Americans not in the labor force were in want of a job compared with 5 million in February, per government estimates . But these workers are not included in the official measure of unemployment. Thus, the COVID-19 recession is comparable more to the Great Depression of the 1930s , when the unemployment rate is estimated to have reached 25%.
Unemployment among all groups of workers increased sharply in the COVID-19 recession. But the experiences of several groups of workers, such as women and black men, in the COVID-19 outbreak vary notably from how they experienced the Great Recession. Here are five facts about how the COVID-19 downturn is affecting unemployment among American workers.

The unemployment rate for women in May (14.3%) was higher than the unemployment rate for men (11.9%). This stands in contrast to the Great Recession, when the unemployment rate for women had peaked at 9.4% in July 2010 compared with a peak of 12.3% for men in January 2010.
One reason women have seen a greater rise in unemployment in the current downturn is that they accounted for the majority of workers on the payrolls of businesses in the leisure and hospitality sector and educational services sector in February. Employment in these two sectors fell by 39% and 15% from February to May, respectively, leading most other sectors by a wide margin. By contrast, job losses in the Great Recession arose primarily from the construction and manufacturing sectors , where women have a much lighter footprint than men.

The unemployment rate for black men in May (15.8%) was substantially less than the peak rate they faced in the Great Recession (21.2%). Black men are the only group among those examined in this analysis for whom such a notable gap exists. The reasons for this are not entirely clear but are likely rooted in the occupation and industry distributions of black men. Recessions in which the turmoil is centered in goods-producing sectors, such as the Great Recession, appear to take a greater toll on the job prospects of black men. The unemployment rate for black men previously topped 20% in the twin recessions of the early 1980s, when manufacturing employment also took a sharp dive .
Among other men, Hispanic workers faced an unemployment rate of 15.5% in May, higher than the rates for Asian (13.3%) and white (9.7%) men. While the unemployment rates for Asian and white men increased sharply in the COVID-19 recession, they remain below the rates for black and Hispanic men.
Hispanic women had the highest rate of unemployment in May (19.5%), compared with other women or men among the nation’s major racial and ethnic groups. The unemployment rate among white women jumped nearly fivefold, climbing from 2.5% in February to 11.9% in May. A steep increase in the unemployment rate among Asian women also pushed their unemployment rate in May (16.7%) to near parity with the unemployment rate among black women (17.2%). The recent experience of white and Asian women stands in contrast to their experience in the Great Recession, when their unemployment rates peaked at levels substantially below the levels reached for black and Hispanic women.

Immigrants saw their unemployment rate jump higher than the rate for U.S.-born workers in the COVID-19 downturn, mirroring their experience in the Great Recession. In February, immigrants and U.S.-born workers had similarly low rates of unemployment, 3.6% and 3.8%, respectively. By May, the unemployment rate for immigrants had risen to 15.7%, compared with 12.4% for U.S.-born workers.
The steeper increase in the unemployment rate for immigrants is driven by the experience of Hispanic workers who comprised 47% of the immigrant workforce in February, compared with 12% of the U.S.-born workforce. Compared with non-Hispanic workers, Hispanic workers are relatively young and are less likely to have graduated from college . Additionally, 44% of Hispanic immigrants in the labor force are estimated to have been unauthorized in 2016 . These characteristics of Hispanic workers make them more vulnerable to job losses in economic downturns.

Workers in all but one age group saw their unemployment rate climb into the double digits in May due to the COVID-19 outbreak, unlike the Great Recession when this was true only for younger workers. The unemployment rate among young adults ages 16 to 24 (25.3%) exceeded the rate among other workers by a substantial margin in May, more than double the rate among workers 35 and older. A key reason is the concentration of young adults in higher-risk industries , such as food services and drinking places, that were more affected by the need for social distancing and government mandated shutdowns.
Changes in the unemployment rate by age in the COVID-19 recession are consistent with patterns in past recessions . During the Great Recession the unemployment rate for young adults peaked at 20% in June 2010, compared with no greater than 10.9% among older workers.

Unemployment rates in the COVID-19 downturn are lower among workers with higher levels of education, as in the Great Recession. The unemployment rate in May was lowest among workers with a bachelor’s degree or higher education (7.2%), the only group among those examined not to experience an unemployment rate in the double digits. In contrast, 18.5% of workers without a high school diploma were unemployed in May. In the Great Recession, the peak unemployment rates for the different groups ranged from 5.3% among those with a bachelor’s degree or higher education to 17.9% among those without a high school diploma.
A unique factor in the COVID-19 recession is the significance of teleworking in keeping people on the job. The option to telework varied considerably across workers in February depending on their education level, with those with a college degree six times as likely to have the option as those without a high school diploma, 62% vs. 9%. Nonetheless, the May unemployment rate among college graduates was nearly four times that of February.
Read the other posts in this series:
- Hispanic women, immigrants, young adults, those with less education hit hardest by COVID-19 job losses
- Unemployment rate is higher than officially recorded, more so for women and certain other groups
- COVID-19 & Politics
- Economic Conditions
- Recessions & Recoveries
- Unemployment

Rakesh Kochhar is a senior researcher at Pew Research Center .
How Americans View the Coronavirus, COVID-19 Vaccines Amid Declining Levels of Concern
Economy remains the public’s top policy priority; covid-19 concerns decline again, lack of preparedness among top reactions americans have to public health officials’ covid-19 response, partisan differences are common in the lessons americans take away from covid-19, many americans say they have shifted their priorities around health and social activities during covid-19, most popular.
1615 L St. NW, Suite 800 Washington, DC 20036 USA (+1) 202-419-4300 | Main (+1) 202-857-8562 | Fax (+1) 202-419-4372 | Media Inquiries
Research Topics
- Email Newsletters
ABOUT PEW RESEARCH CENTER Pew Research Center is a nonpartisan fact tank that informs the public about the issues, attitudes and trends shaping the world. It conducts public opinion polling, demographic research, media content analysis and other empirical social science research. Pew Research Center does not take policy positions. It is a subsidiary of The Pew Charitable Trusts .
© 2024 Pew Research Center
The unemployment impacts of COVID-19: lessons from the Great Recession
Subscribe to the economic studies bulletin, stephanie aaronson and stephanie aaronson senior associate director, division of research and statistics - federal reserve board francisca alba francisca alba former research analyst - economic studies.
April 15, 2020
- 12 min read
Efforts to stop the spread of the novel coronavirus—particularly the closure of nonessential businesses—are having an unprecedented impact on the U.S. economy. Nearly 17 million people filed initial claims for unemployment insurance over the past three weeks, suggesting that the unemployment rate is already above 15 percent [1] —well above the rate at the height of the Great Recession.
However, these aggregate statistics mask substantial variation across the country. Some cities, such as New York, are already experiencing full blown pandemics and non-essential business activity has been substantially halted. In other areas economic activity has slowed less. This variation represents the degree of spread of the virus, the timing and extent of the state and local response, and the sectoral mix of economic activity. Work by our colleagues suggests that metropolitan areas dependent on energy, tourism, and leisure and hospitality are likely to suffer greater slowdowns, while those that depend more on industry, agriculture, or professional services will suffer less.

Figure 1 [2] displays the sum of initial claims for unemployment insurance filed during the weeks ending March 21, March 28, and April 4 for selected states as a share of the labor force [3] . As can be seen, in the hardest hit areas, the number of initial claims as a share of the labor force was double or triple that of the least affected areas. While some of the differential likely reflects variation in unemployment insurance systems across states, this explanation is unlikely to explain the entire differential. Since, as can be seen, the states with relatively more claims include those dependent on tourism (Nevada and Hawaii) and those which have been hard hit by the virus ( Rhode Island, Pennsylvania, and Michigan ), while those with few claims have low incidence of the virus. Hence, it does appear, at least to start, there has been an idiosyncratic aspect to how states, and implicitly metropolitan areas, are affected by the pandemic. Eventually, however, a shock of the magnitude of the novel coronavirus will certainly result in a national recession, affecting the entire country to a greater or lesser degree.
In this post, we examine how shocks to the economy, like the one we are experiencing now with the coronavirus, play out at the metropolitan level, with a specific focus on the unemployment rate. We use as our laboratory the Great Recession, which started in metropolitan areas that were most affected by the housing bubble and bust, but then spread nationally. In line with previous research, we find that there is persistence in the unemployment rate across metropolitan areas. Idiosyncratic shocks disrupt these persistent differentials, but over time local economies adjust, and metropolitan areas tend to re-sort back to their previous place in the distribution. Our results also suggest that negative macroeconomic shocks tend to affect high-unemployment rate areas most harshly, and that strong macroeconomic performance helps to ameliorate not only the aggregate shocks, but also the differences across metropolitan areas.
Metropolitan Areas Tend to Have Similar Unemployment Rates Over Time
As has been well documented, the economies of metropolitan areas vary in structural ways, for instance based on their industrial mix, geography , demographics , and infrastructure. These structural differences result in persistent differences in labor market outcomes, including unemployment rates [4] .
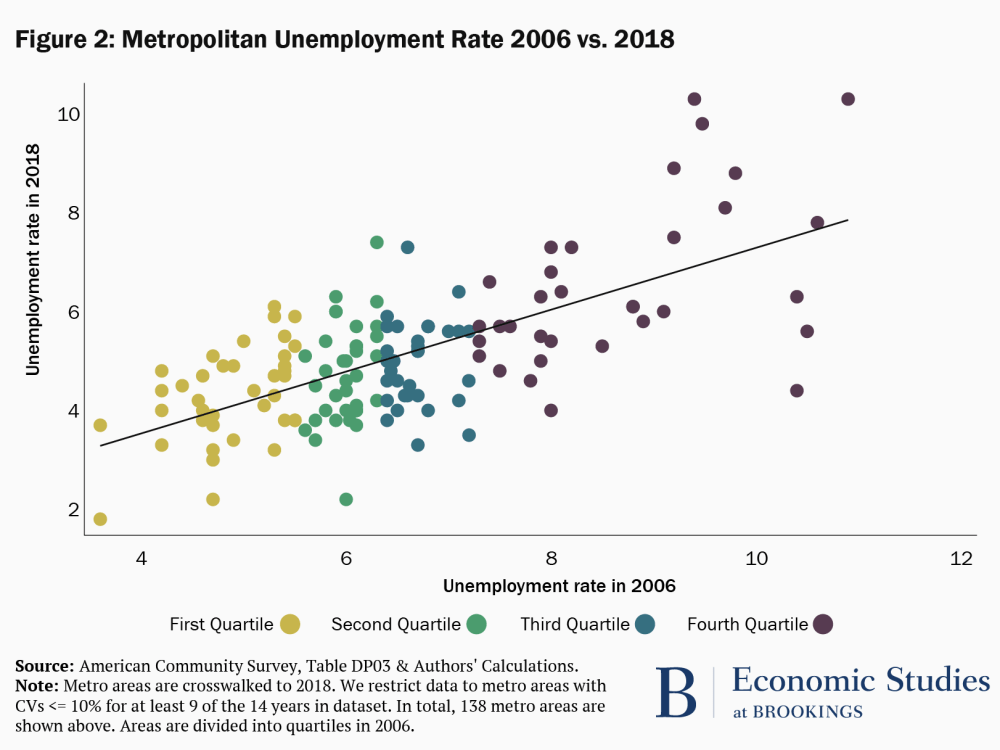
In Figure 2, we examine the persistence of the unemployment rate by metropolitan area. Each dot represents a metropolitan area, and dots are color coded according to their quartile in the distribution of unemployment rates in 2006. The x-axis denotes the metropolitan area’s unemployment rate in 2006 and the y-axis the area’s unemployment rate in 2018. These are both years at which the economy was near, but not at its peak.
Figure 2 shows a clear, positive relationship between unemployment rates in 2006 and 2018: lower unemployment rates in 2006 are associated with lower unemployment rates in 2018. Notably this relationship holds across the entire sample, and also within the unemployment rate quartiles. Our results suggest that a 1 percentage point higher unemployment rate in 2006 is associated with a 0.6 percentage point higher unemployment rate in 2018. Moreover, the unemployment rate in 2006 explains 44 percent of the variation in the unemployment rate in 2018.
Although Metropolitan Areas Experiencing Idiosyncratic Shocks Undergo Large Changes in Their Unemployment Rates, They Tend to Revert Back to Their Previous Place in the Distribution:
In addition to the persistent characteristics that shape the economies of metropolitan areas over long periods, idiosyncratic events specific to metropolitan areas can also have a significant impact. Examples of these types of shocks include storms, like Hurricane Katrina, which reshaped New Orleans, or technical changes such as hydraulic fracturing, which made it possible to extract oil and gas from areas where they were previously inaccessible. These idiosyncratic shocks may or may not have long-lasting impacts.
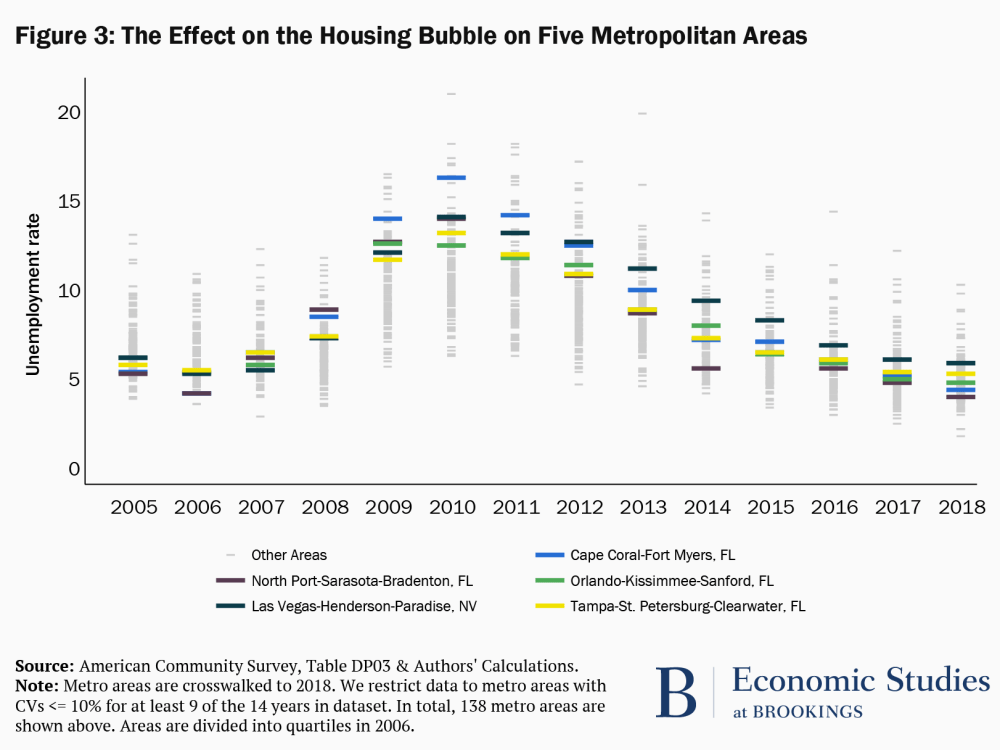
Figure 3 shows the distribution of metropolitan area unemployment rates over a fourteen-year period. The figure highlights five metropolitan areas. In 2006 these highlighted areas were in the first quartile of the distribution; meaning that these areas had lower levels of unemployment than 75 percent of the metropolitan areas displayed in the figure. By 2009, these five areas had unemployment rates that were in the top quartile of the distribution that year. While it is true that the unemployment rate on aggregate was also rising during this period (as can be seen by the fact that the unemployment rates of all the other metropolitan areas, represented by the light gray bars, move up), these areas were affected earlier and by more—a function of the fact that they were hit by a specific, negative idiosyncratic shock: the bursting of the housing bubble. These metropolitan areas are located in Florida and Nevada, states with large housing bubbles, and the specific metropolitan areas highlighted experienced large drops in local housing prices when the bubble burst in 2007 [5] .
Like the financial crisis, the current crisis also has an idiosyncratic component. As noted in the introduction, metropolitan areas first affected by the virus closed non-essential businesses earlier. Moreover, the economies of metropolitan areas reliant on tourism, leisure and hospitality, and energy slowed quickly as travel restrictions were imposed and global demand declined. Other areas with fewer cases of the virus and those with economies dependent on industry, agriculture, or professional services appear so far to have been less impacted.
Interestingly, Figure 3 also illustrates that by 2018 these metropolitan areas that faced a negative shock from the bursting of the housing bubble had largely recuperated, with unemployment rates returning to levels similar to 2005/2006. This finding is in line with Blanchard and Katz (1992) who show that state-level unemployment rates tend to recover approximately five to seven years after experiencing a negative shock to employment. Note, this isn’t to say that adjustment is automatic—indeed specific policies geared at addressing idiosyncratic shocks may be necessary to help local areas cope when they face a crisis.
A Strong National Economy Helps All Metropolitan Areas, Even Those with Persistently High Unemployment Rates
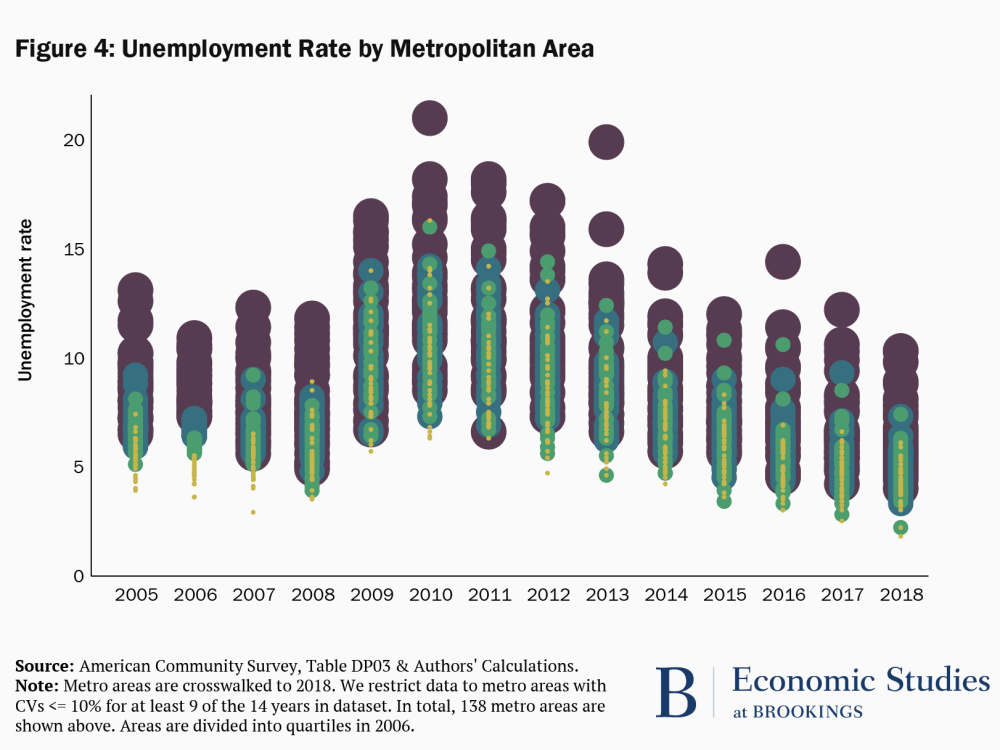
Figure 4 plots the distribution of the unemployment rate by metropolitan area from 2005 to 2018, with dots of different colors and sizes identifying the quartiles of the unemployment rate distribution in 2006, as in Figure 2. (We make the dots different sizes to make it possible to follow the movements in the unemployment rates of the metropolitan areas from year to year.)
There are several phenomena that can be observed in this graph. One is the central tendency of the metropolitan area unemployment rates—as a whole, are the unemployment rates relatively high or low in a given year—which reflects the state of the business cycle. The second is how disperse the unemployment rates are—are the unemployment rates across the metropolitan areas relatively similar (are they clumped together) or are they spread out, with some areas having high rates and others relatively low rates. And the third is the relative position of the unemployment rates of specific metropolitan areas—do metropolitan areas that have high or low unemployment rates to start remain in those positions over the entire time period. To help elucidate these points, we also show the mean, range, and variance of the unemployment rates for groups of years in Table 1.
The first thing to note in Figure 4 is the impact of the Great Recession across metropolitan areas. As the recession gained full force in 2009, metropolitan unemployment rates as a whole began to increase. Second, the differences in unemployment rates across metropolitan areas widened in years in which the economy was underperforming. And, metropolitan areas that started off relatively disadvantaged tended to experience the highest unemployment rates during the recession. This information is summarized in Table 1, where we can see that the mean, variance, and range of the unemployment rate all increase substantially during the recession from the pre-recession period.
Table 1: Spread of the Unemployment Rate
| Years | Mean | Variance | Range |
| 2005-2008 | 6.6 | 2.5 | 10.2 |
| 2009-2011 | 10.6 | 6.1 | 15.3 |
| 2012-2014 | 8.6 | 5.5 | 15.7 |
| 2015-2018 | 5.8 | 2.8 | 12.6 |
Of course, this aggregate phenomenon is being laid on top of the idiosyncratic shocks we discussed previously, in particular, the bursting of the housing bubble. For instance, the metropolitan areas that we identified as having been particularly hard hit by the bursting of the housing are among those metropolitan areas captured by the yellow dots, which rise much more than average during the financial crisis and recession. But, as the economy recovered, and the aggregate unemployment rate fell, metropolitan area unemployment rates began to converge again. Many areas that saw the largest deterioration in their unemployment rates during the financial crisis and the Great Recession experienced substantial improvement. This finding is consistent with prior research demonstrating that strong macroeconomic conditions are particularly beneficial for workers that are disadvantaged in the labor market.
Notably, the distribution of unemployment rates in 2018 looks fairly similar to that of 2005 and 2006. By this we mean that metropolitan areas with the lowest unemployment rates prior to the Great Recession (the yellow dots) tend to have lower unemployment rates in 2018 and metropolitan areas with the highest unemployment rates (the purple dots) tend to have higher unemployment rates. This is just another way of illustrating the result in Figure 2, showing the persistence of the unemployment rate across metropolitan areas over time, even in the face of significant idiosyncratic and macroeconomic shocks.
Policy Implications for COVID-19:
Metropolitan areas have high (or low) unemployment rates for different reasons. First, there are structural causes—such as average education levels or industry mix—which mean that some areas tend to have high or low unemployment rates over time. Second, there are local idiosyncratic shocks that might cause metropolitan areas to see large but typically transitory increases or decreases in their unemployment rates. Finally, metropolitan areas are buffeted by the business cycle—aggregate shocks that play out similarly, although not identically, across metropolitan areas.
The current crisis in which we find ourselves is no different. Before the pandemic reached our shores, metropolitan areas had distinct capacities to respond based on their structural differences. The impact of the virus will vary across metropolitan areas depending on their exposure and industrial mix. Finally, all metropolitan areas will experience the spillovers from the deep recession as economic activity is curtailed.
Policymakers should take into account these different types of shocks that are buffeting localities, because they suggest different policies. Our results indicate that policies aimed at ensuring liquidity in financial markets now and stimulating aggregate demand once it becomes safe to engage in non-essential economic activity will have a broad positive impact on economic outcomes across metropolitan areas and will reduce disparities between them. However, some localities will require more help, either because they face a particularly pernicious impact from the pandemic or because long-standing structural factors make it particularly difficult for them to weather the economic headwinds we face. Our colleagues Louise Sheiner and Sage Belz show that state tax revenues declined by about 9 percent during the Great Recession and argue that recently passed legislation—such as CARES Act and FFCRA—does not provide enough funding to prevent states and localities from cutting spending. Similarly, our colleague Matt Fiedler and Wilson Powell III make the case for increasing the federal match rate for Medicaid in proportion to the amount that the state’s unemployment rate exceeds some threshold. And the Metropolitan program discuss policies that would bolster metropolitan areas by supporting small businesses.
Becca Portman contributed to the graphics/data visualization for this blog.
[1] This is a back-of-the-envelope calculation which assumes all initial claims translate into spells of unemployment. We take the number of initial claims from the weeks ending in April 4, March 28, and March 21 (16,780 thousand); add the number of unemployed people in March 2020 (7140 thousand); and divide by the March 2020 labor force: (16,780 + 7140)/162913 = 14.68%. Although it is not always the case that initial claims translate into spells of unemployment, this calculation is, nonetheless, most likely an underestimate of the unemployment rate as not all people who become unemployed are eligible to receive benefits and not everyone who is eligible for unemployment insurance applies. Moreover, this estimate likely understates the number of people who have tried to file claims in recent weeks, due to limitations with the state unemployment insurance systems which have been overwhelmed. That said, there is currently less certainty about the relationship between insured unemployment and aggregate unemployment because of changes in the unemployment insurance eligibility rules. [2] Note that the ratios in this graph should be interpreted with caution. We choose the total labor force as the denominator because recent legislation has changed the types of workers covered by unemployment insurance. However, this denominator likely overstates the number of people covered by unemployment insurance. The numerator is not without issues either. As mentioned above, it is likely to understate the number of people who have attempted to file claims, due to limitations with the unemployment insurance systems. [3] Claims data by metropolitan area aren’t readily available. [4] Katheryn Russ and Jay Shambaugh show that the persistence of the unemployment rate is related to the average level of education in a county. They find that counties with lower levels of education have higher levels of persistence. In other words, areas with lower, average education are more likely to get “stuck” with a high unemployment rate over time. [5] We also examine metropolitan areas that were in the fourth quartile of the distribution in 2006 and subsequently moved to near the bottom of the distribution in 2009. We find that these areas are mostly located in places with positive energy shocks.
Related Content
David Wessel
April 1, 2020
Aaron Klein
March 31, 2020
Philip A. Wallach, Justus Myers
Labor & Unemployment
Economic Studies
Elijah Asdourian, David Wessel
July 1, 2024
June 28, 2024
Anthony F. Pipa
June 25, 2024
An Unemployment Crisis after the Onset of COVID-19
Nicolas Petrosky-Nadeau and Robert G. Valletta
Download PDF (115 KB)
FRBSF Economic Letter 2020-12 | May 18, 2020
The COVID-19 pandemic has upended the U.S. labor market, with massive job losses and a spike in unemployment to its highest level since the Great Depression. How long unemployment will remain at crisis levels is highly uncertain and will depend on the speed and success of coronavirus containment measures. Historical patterns of monthly flows in and out of unemployment, adjusted for unique aspects of the coronavirus economy, can help in assessing potential paths of unemployment. Unless hiring rises to unprecedented levels, unemployment could remain severely elevated well into next year.
The wave of initial job losses during the coronavirus disease 2019 (COVID-19) pandemic has been massive, with more than 20 million jobs swept away between March and April. This is much larger than losses recorded during similar time frames in any other postwar recession. As a result, the April unemployment rate spiked to the highest level recorded since the Great Depression of the 1930s.
In this Economic Letter , we assess possible paths for unemployment through 2021. Although the initial scale of the crisis is clear, substantial uncertainty surrounds the future path of unemployment. This uncertainty primarily revolves around the success of virus containment measures and how quickly economic activity can recover. Fundamental measurement challenges are also likely to affect the official unemployment rate: some laid-off workers cannot actively search for new jobs because of shelter-in-place restrictions and hence may be counted as out of the labor force, rather than unemployed.
To assess the possible path of the measured unemployment rate through next year, we focus on the underlying monthly flows in and out of unemployment, accounting for historical patterns and unique aspects of the coronavirus economy; our approach and results are described in detail in Petrosky-Nadeau and Valletta (2020). Our analysis suggests that returning to pre-outbreak unemployment levels by sometime in 2021 would require a significantly more rapid pace of hiring than during any past economic recovery.
Initial wave of job losses and unemployment
Even before the Bureau of Labor Statistics (BLS) released April employment and unemployment numbers on May 8, the unprecedented scale of job losses due to coronavirus containment measures was clear. About 25 million new unemployment insurance (UI) claims were filed between mid-March, when U.S. containment measures started to spread widely and the BLS monthly survey was conducted, and mid-April when the next month’s BLS survey was conducted. During periods of intensive job loss, weekly reports on new UI claims provide a good measure of job losses because most laid-off workers are eligible for UI benefits. However, the current massive scale of new claims has swamped state UI agencies and likely delayed processing of many claims. As such, the recent surge should be interpreted as a loose lower-bound estimate of initial job losses.
A comparison with the Great Recession of 2007-09 starkly illustrates the severity of the current situation (Figure 1). Initial UI claims during the first month of the COVID-19 crisis were about 10 times larger than claims during the worst periods of the Great Recession.
Figure 1 Monthly initial unemployment insurance claims

Note: Data from the U.S. Department of Labor, not seasonally adjusted (last two data points rounded to nearest thousand; April data through May 2). Gray bar indicates NBER recession dates.
These initial job losses, combined with a likely pronounced reduction in hiring activity, imply a sharp increase in the unemployment rate. Before the April BLS report was released, we projected that the unemployment rate was likely to rise nearly 15 percentage points, from 4.4% in March to 19.0% in April.
Other recent projections of the April unemployment rate span a very wide range (Faria-e-Castro 2020, Wolfers 2020, Coibion, Gorodnichenko, and Weber 2020, and Bick and Blandin 2020). The wide range partly reflects the challenge of measuring unemployment when shelter-in-place restrictions prevent active job search in much of the country. This is evident in the estimates by Coibion et al. (2020) and Bick and Blandin (2020), which differed substantially despite their reliance on careful surveys designed to approximate the official BLS approach.
The official April employment report released on May 8 showed that unemployment rose to 14.7%, a huge increase but below our projection. However, the report also noted a large increase in the number of workers on unpaid absences, likely reflecting virus-related business closures. Counting these workers as unemployed would push the unemployment rate much closer to our 19% projection. We therefore have not modified our prior projections.
Unemployment projections based on labor market flows
Our approach to projecting the unemployment rate relies on the monthly flows between unemployment, employment, and out of the labor force (nonparticipation), similar to Şahin and Patterson (2012). In particular, the monthly change in the unemployment rate reflects the difference between the number who enter unemployment (inflows) and the number who exit unemployment (outflows), with employment and nonparticipation as possible initial or subsequent status. This framework accounts for the key determinants of pandemic-related unemployment, with initial UI claims (inflows through job loss) and depressed hiring (outflows) determining the initial spike in unemployment. Using this approach, we explore different scenarios for unemployment through the end of 2021. For all scenarios, we assume that job losses are most severe in April (about 25 million), then ease substantially in May (7.8 million) and June (2.6 million), before returning to their historical trend in July (1.4 million).
The path of the unemployment rate afterward depends on unemployment outflows, primarily reflected in the pace of hiring among the pool of unemployed individuals. Tremendous uncertainty surrounds the timing and strength of the hiring surge as the economy recovers. If the virus is contained quickly and the economic recovery is vigorous, hiring could rapidly resume, particularly if many businesses and workers have maintained their connections. However, hiring could be slow if virus outbreaks or continued containment measures make employers hesitant based on low demand for their products. We therefore explore a range of hiring scenarios over the coming months.
The first scenario, “historical outflow dynamics,” assumes that the pace of hiring corresponds statistically to the typical recovery from past recessions. Because hiring tends to bounce back slowly following recessions, and given the severity of the current downturn, this scenario is relatively adverse.
Our second scenario, “hiring bounce,” incorporates very strong hiring activity following an assumed end of COVID-19 restrictions in July 2020. This scenario provides a baseline for assessing the pace of hiring required to reverse the initial labor market shock. It assumes a return to pre-outbreak hiring rates by the end of the third quarter of 2020. However, the pace of hiring implied by this scenario is extremely high by historical standards given the vast pool of unemployed individuals. In particular, this scenario requires around 9 million hires from unemployment per month during the third quarter, nearly four times faster than the most robust hiring rate during the recovery from the Great Recession.
Our third scenario, “GDP/hiring forecast,” bases hiring projections on the historical relationship between GDP growth and overall exit rates from unemployment to employment or nonparticipation. This requires a GDP forecast. We rely on a recent San Francisco Fed forecast of GDP growth for 2020-21, specifically the more favorable of two alternatives discussed in qualitative terms in Leduc (2020). It assumes that growth bounces back in the second half of this year and continues at a strong pace next year.
Figure 2 shows the unemployment paths for these scenarios. In the historical outflow dynamics scenario (dark blue line), unemployment quickly peaks around 20% and then stays in double digits through early 2021. By contrast, the hiring bounce scenario (light blue line) reflects a stronger recovery in hiring activity, so the unemployment rate drops much more rapidly. At the end of 2020 most of the job losses have been reversed, and unemployment approaches pre-outbreak levels. For the GDP/hiring forecast scenario (yellow line), unemployment peaks above 18% in the second quarter of 2020, followed by a rapid decline in the third quarter due to underlying limited changes in the hiring rate implied by its historical relationship with GDP growth.
Figure 2 Unemployment rate paths under different scenarios

Incorporating unemployment and nonparticipation ambiguities
As noted earlier, widespread shelter-in-place restrictions may preclude active job searches among laid-off workers, causing them to report themselves as out of the labor force rather than unemployed. Consistent with this, the official labor force participation rate fell 2.5 percentage points to 60.2% in April. We explore the potential impact of these measurement challenges through alternative assumptions about flow rates between different labor market states.
In particular, historical patterns of worker flows from employment to nonparticipation then back into employment during recoveries suggest that nearly half of those workers laid off during the pandemic could leave the labor force upon suffering a job loss. This moderates the initial rise in unemployment, shown as the lower participation scenario (red line) in Figure 2. As individuals return to the labor market during the recovery, lifting the labor force participation rate back toward its previous trend, the pace of return to a pre-outbreak unemployment rate is also muted. In fact, the historical outflow dynamics and lower participation scenarios converge at 8% unemployment in mid-2021. However, these two scenarios imply vastly different trajectories for the labor force participation rate. Figure 3 shows the paths for these scenarios over an extended time frame relative to the trend projected by the Congressional Budget Office (2020).
Figure 3 Labor force participation rate under different scenarios

Conclusions: An uncertain road to recovery
The COVID-19 pandemic has created tremendous labor market disruptions and profound hardship throughout the United States and the world. This is partly reflected in the sudden unprecedented increase in the U.S. unemployment rate in April, the first month for which the full effects of coronavirus containment measures are evident. To get a handle on the severity of the labor market disruption, we assess possible paths for unemployment through the end of 2021. Tremendous uncertainty surrounds unemployment projections over the next few years, so we do not claim that any specific scenario qualifies as “likely.” On the pessimistic side, absent a historically unprecedented burst of hiring, the unemployment rate could remain in double digits through 2021. From a more optimistic perspective, if shutdowns are lifted quickly and employers capitalize on the large pool of available workers by ramping up hiring, the unemployment rate could be back down near its pre-outbreak level by mid-2021.
Uncertainty about the path of the unemployment rate also reflects measurement challenges arising from the ambiguous labor force status of laid-off workers whose active job search is limited by shelter-in-place measures. This may temper the official unemployment rate, but at the expense of a lower labor force participation rate, which is an alternative indicator of labor market dislocation and hardship. Given the implied uncertainty about the measurement of future labor market conditions, it is imperative to closely monitor a wide range of indicators to assess how the U.S. labor market is evolving in response to the COVID-19 shock.
Nicolas Petrosky-Nadeau is a vice president in the Economic Research Department of the Federal Reserve Bank of San Francisco.
Robert G. Valletta is a senior vice president in the Economic Research Department of the Federal Reserve Bank of San Francisco.
Bick, Alexander, and Adam Blandin. 2020. “Real Time Labor Market Estimates during the 2020 Coronavirus Outbreak.” Manuscript, Arizona State University, April 15.
Coibion, Olivier, Yuriy Gorodnichenko, and Michael Weber. 2020. “Labor Markets During the COVID-19 Crisis: A Preliminary View.” BFI Working Paper, Becker Friedman Institute for Economics, University of Chicago, April 13.
Congressional Budget Office. 2020. “The Budget and Economic Outlook: 2020 to 2030.” Report 56020, January 28.
Faria-e-Castro, Miguel. 2020. “Back-of-the-Envelope Estimates of Next Quarter’s Unemployment Rate.” On the Economy, FRB St. Louis blog, March 24.
Leduc, Sylvain. 2020. “FedViews.” FRB San Francisco, April 6.
Petrosky-Nadeau, Nicolas, and Robert G. Valletta. 2020. “Unemployment Paths in a Pandemic Economy.” FRB San Francisco Working Paper 2020-18, May.
Şahin, Ayşegül, and Christina Patterson. 2012. “The Bathtub Model of Unemployment: The Importance of Labor Market Flow Dynamics.” Liberty Street Economics, FRB New York blog, March 28.
Wolfers, Justin. 2020. “The Unemployment Rate Is Probably Around 13%.” New York Times (The Upshot), April 16.
Opinions expressed in FRBSF Economic Letter do not necessarily reflect the views of the management of the Federal Reserve Bank of San Francisco or of the Board of Governors of the Federal Reserve System. This publication is edited by Anita Todd and Karen Barnes. Permission to reprint portions of articles or whole articles must be obtained in writing. Please send editorial comments and requests for reprint permission to [email protected]
- Share full article
Advertisement
Supported by
What’s Going On in This Graph? | Unemployment During the Pandemic
Who wants a job, but doesn’t have one? How has the composition of the unemployed in the United States changed during the pandemic?

By The Learning Network
This graph shows the composition of the unemployed in the United States from January – September 2020. The graph appeared elsewhere on NYTimes.com.
By Friday morning, Nov. 6, we will reveal the graph’s free online link, additional background and questions, shout-outs for great student headlines, and Stat Nuggets.
After looking closely at the graph above (or at this full-size image ), answer these four questions:
What do you notice?
What do you wonder?
What impact does this have on you and your community?
What’s going on in this graph? Write a catchy headline that captures the graph’s main idea.
The questions are intended to build on one another, so try to answer them in order.
2. Next, join the conversation online by clicking on the comment button and posting in the box. (Teachers of students younger than 13 are welcome to post their students’ responses.)
3. Below the response box, there is an option for students to click on “Email me when my comment is published.” This sends the link to their response which they can share with their teacher.
4. After you have posted, read what others have said, then respond to someone else by posting a comment. Use the “Reply” button to address that student directly.
On Wednesday, Nov. 4, teachers from our collaborator, the American Statistical Association , will facilitate this discussion from 9 a.m. to 2 p.m. Eastern time.
We are having trouble retrieving the article content.
Please enable JavaScript in your browser settings.
Thank you for your patience while we verify access. If you are in Reader mode please exit and log into your Times account, or subscribe for all of The Times.
Thank you for your patience while we verify access.
Already a subscriber? Log in .
Want all of The Times? Subscribe .

An official website of the United States government
The .gov means it’s official. Federal government websites often end in .gov or .mil. Before sharing sensitive information, make sure you’re on a federal government site.
The site is secure. The https:// ensures that you are connecting to the official website and that any information you provide is encrypted and transmitted securely.
- Publications
- Account settings
Preview improvements coming to the PMC website in October 2024. Learn More or Try it out now .
- Advanced Search
- Journal List
- Elsevier - PMC COVID-19 Collection
Unemployment in the time of COVID-19: A research agenda ☆
David l. blustein.
a Boston College, United States of America
b University of Florida, United States of America
Joaquim A. Ferreira
c University of Coimbra, Portugal
Valerie Cohen-Scali
d Conservatoire National des Arts et Métiers, France
Rachel Gali Cinamon
e University of Tel Aviv, Israel
Blake A. Allan
f Purdue University, United States of America
This essay represents the collective vision of a group of scholars in vocational psychology who have sought to develop a research agenda in response to the massive global unemployment crisis that has been evoked by the COVID-19 pandemic. The research agenda includes exploring how this unemployment crisis may differ from previous unemployment periods; examining the nature of the grief evoked by the parallel loss of work and loss of life; recognizing and addressing the privilege of scholars; examining the inequality that underlies the disproportionate impact of the crisis on poor and working class communities; developing a framework for evidence-based interventions for unemployed individuals; and examining the work-family interface and unemployment among youth.
This essay reflects the collective input from members of a community of vocational psychologists who share an interest in psychology of working theory and related social-justice oriented perspectives ( Blustein, 2019 ; Duffy, Blustein, Diemer, & Autin, 2016 ). Each author of this article has contributed a specific set of ideas, which individually and collectively reflect some promising directions for research about the rampant unemployment that sadly defines this COVID-19 crisis.
Our efforts cohere along several assumptions and values. First, we share a view that unemployment has devastating effects on the psychological, economic, and social well-being of individuals and communities ( Blustein, 2019 ). Second, we seek to build on the exemplary research on unemployment that has documented its impact on mental health ( Paul & Moser, 2009 ; Wanberg, 2012 ) and its equally pernicious impact on communities ( International Labor Organization, 2020b ). Third, we hope that this contribution charts a research agenda that will inform practice at individual and systemic levels to support and sustain people as they grapple with the daunting challenge of seeking work and recovering from the psychological and vocational fallout of this pandemic.
The advent of this period of global unemployment is connected causally and temporally to considerable loss of life and illness, which is creating an intense level of grief and trauma for many people. The first step in developing a research agenda for unemployment during the COVID-19 era is to describe the nature of this process of loss in so many critical sectors of life. A major research question, therefore, is to what extent does this unemployment crisis vary from previous bouts of unemployment which were linked to economic fluctuations? In addition, exploring the role of loss and trauma during this crisis should yield research findings that can inform psychological and vocational interventions as well as policy guidance to support people via civic institutions and communities.
1. Recognizing and channeling our own privilege
In Joe Pinker's (2020) Atlantic essay entitled, “ The Pandemic Will Cleave America in Two”, he highlights two distinct experiences of the pandemic. One is an experience felt by those with high levels of education in stable jobs where telework is possible. Lives are now more stressful, work has been turned upside down, childcare is challenging, and leaving the house feels ominous. The other is an experience felt by the rest of the working public – those who cannot work from home and thus are putting themselves at risk every day, whose jobs have been either lost or downsized, and who are wondering not only if they will catch the virus but whether they have the means and resources to survive. As psychologists and professors, the vast majority of “us” (those writing this essay and those reading it) are extremely fortunate to be in the first group. The pandemic has only served to exacerbate the extent of this privilege.
Given our relative position of power, what are ways we can change our research to be more meaningful and impactful to those outside of our bubble? We propose that the recent work on radical healing in communities of color – where the research is often done in collaboration with the participants and building participant agency is an explicit goal - can inform our path forward ( French et al., 2020 ; Mosley et al., 2020 ). Work has always been a domain where individuals experience distress and marginalization. However, in the current pandemic and into the unforeseeable future, this will only exponentially increase. Sure, we can do surveys about people's experiences and provide incentives for their time. And of course qualitative work will allow us to more directly connect with participants and hear their voices. But what is most needed is research where participants receive tangible benefits to improve their work lives. We, as privileged scholars, need to think about how we can use our expertise in studying work to infuse our studies with real world benefits. We see this as occurring on a spectrum in terms of scholars' time and resources available – from information sharing about resources to providing job-seeking or work-related interventions. In our view, now is the time to truly commit to using work-related research not just as a way to build scholarly knowledge, but as a way to improve lives.
2. Inequality and unemployment
Focusing research efforts on real-world benefits means acknowledging how the COVID-19 pandemic has exposed and exacerbated existing inequities in the labor market. Millions of workers in the U.S. have precarious jobs that are uncertain in the continuity and amount of work, do not pay a living wage, do not give workers power to advocate for their needs, or do not provide access to basic benefits ( Kalleberg, 2009 ). Power and privilege are major determinants of who is at risk for precarious work, with historically marginalized communities being disproportionately vulnerable to these job conditions ( International Labor Organization, 2020a ). In turn, people with precarious work experience chronic stress and uncertainty, putting them at risk for mental health, physical, and relational problems ( Blustein, 2019 ). These risk factors may further worsen the effects of the COVID-19 crisis while simultaneously exposing inequities that existed before the crises.
The COVID-19 pandemic is an opportunity for researchers to define and describe how precarious work creates physical, relational, behavioral, psychological, economic, and emotional vulnerabilities that worsen outcomes from crises like the COVID-19 pandemic (e.g., unemployment, psychological distress). For example, longitudinal studies can examine how precarious work creates vulnerabilities in different domains, which in turn predict outcomes of the COVID-19 pandemic, including unemployment and mental health. This may include larger scale cohort studies that examine how the COVID-19 crisis has created a generation of precarity among people undergoing the school-to-work transition. Researchers can also study how governmental and nonprofit interventions reduce vulnerability and buffer the relations between precarious work and various outcomes. For example, direct cash assistance is becoming increasingly popular as an efficient way to help people in poverty ( Evans & Popova, 2014 ). However, dominant social narratives (e.g., the myth of meritocracy, the American dream) blame people with poor quality work for their situations. Psychologists have a critical role in (a) documenting false social narratives, (b) studying interventions to provide accurate counter narratives (e.g., people who receive direct cash assistance do not spend money on alcohol or drugs; most people who need assistance are working; Evans & Popova, 2014 ), and (c) studying how to effectively change attitudes among the public to create support for effective interventions.
3. Work-family interface
Investigating the work-family interface during unemployment may appear contradictory. It can be argued that because there is no paid work, the work-family interface does not exist. But ‘work’ is an integral part of people's lives, even during unemployment; for example, working to find a job is a daunting task that is usually done from home. Thus, the work-family interface also exists during unemployment, but our knowledge about this is limited. Our current knowledge on the work-family interface primarily focuses on people who work full-time and usually among working parents with young children ( Cinamon, 2018 ). As such, focusing on the work-family interface during periods of unemployment represents a needed research agenda that can inform public policy and scholarship in work-family relationships.
The rise in unemployment due to COVID-19 relates not only to the unemployed, but also to other family members. Important research questions to consider are how are positive and negative feelings and thoughts about the absence of work conveyed and co-constructed by family members? What family behaviors and dynamics promote and serve as social capital for the unemployed and for the other members of the family? Do job search behaviors serve as a form of modeling for other family members? What are the experiences of unemployed spouses and children, and how do these experiences shape their own career development? These issues can be discerned among unemployed people of different ages, communities, and cultures.
Several research methods can promote this agenda. Participatory action research can enable vocational researchers to be proactive and involved in increasing social solidarity. This approach requires mutual collaboration between the researcher and families wherein one of the parents is unemployed. By giving them voice to describe their experiences, thoughts, ideas, and suggested solutions, we affirm inclusion of the individuals living through the new reality, thereby conveying respect and acknowledgment. At the same time, we can bring ideas, knowledge, and social connections to the families that can serve as social capital. In addition, longitudinal quantitative studies among unemployed families that explore some of the issues noted above would be important as a means of exploring how the new unemployment experience is shaping both work and relationships. We also advocate that meaningful incentives be offered to participants in all of these studies, such as online job search workshops and career education interventions for adolescents.
4. Strategies for dealing with unemployment in the pandemic of 2020
Forward-looking governments and organizations (such as universities) should begin thinking about how to deal with the immediate and long-term consequences of the economic crisis created by COVID-19, especially in the area of unemployment. Creating meaningful interventions to assist the newly unemployed will be difficult because of the unprecedented number of individuals and families that are affected and because of the diverse contextual and personal factors that characterize this new population. Because of this diversity of contextual and personal factors, different interventions will be required for different patterns of individual/contextual characteristics ( Ferreira et al., 2015 ).
In broad outline, a research program to address the diversity of issues identified above could be envisioned to consist of several distinct phases: First, it would be necessary to carefully assess the external circumstances of the unemployed individual's job loss, including the probability of re-employment, financial condition, family composition, and living conditions, among others. Second, an assessment should be made of the individual's strengths and growth edges, particularly as they impact the current situation. These assessments could be performed via paper or online questionnaire. Based on these initial assessments, the third phase would involve using statistical analyses such as cluster analysis to form distinct groups of unemployed individuals, perhaps based in part on the probability of re-employment following the pandemic. The fourth phase would focus on determining the types (and/or combinations) of intervention most appropriate for each group (e.g., temporary government assistance; emotional support counseling; retraining for better future job prospects; relocation, etc.). Because access to specific types of assistance is frequently a serious challenge, especially for underprivileged individuals, the fifth phase should emphasize facilitating individuals' access to the specific assistance they need. Finally, the sixth phase of research should evaluate the efficacy of this approach, although designing such a large research program in a crisis situation requires ongoing process evaluation throughout the design and implementation stages of the research program.
5. Unemployment among youth
As reflected in a recent International Labor Organization (2020a) report on the impact of the COVID-19 crisis, youth were already vulnerable within the workforce prior to the crisis; the recent advent of massive job losses and growing precarity of work is having particularly painful impacts on young people across the globe. The COVID-19 economic crisis with vast increases in unemployment (and competition between workers) and the probable growth of digitalization may result in a major dislocation of young workers from the labor market for some time ( International Labor Organization, 2020b ). To provide knowledge to meet this daunting challenge, researchers should develop an agenda focusing on two major components—the first is a participatory mode of understanding the experience of youth and the second is the development of evidence-based interventions that are derived from this research process.
The data gathering aspect of this research agenda optimally should focus on understanding unemployed youths' perception of their situation (opportunities, barriers, fears, and intentions) and of the new labor market. We propose that research is needed to unpack how youth are constructing this new reality, their relationship to society, to others, and to the world. This crisis may have changed their priorities, the meaning of work, and their lifestyle. For example, this crisis may have led to an awareness of the necessity of developing more environmentally responsible behaviors ( Cohen-Scali et al., 2018 ). These new life styles could result in skills development and increased autonomy and adaptability among young people. In addition, the focus on understanding youths' experience, which can encompass qualitative and quantitative methods, should also include explorations of shifts in youths' sense of identity and purpose, which may be dramatically affected by the crisis. The young people who are without work should be involved at each step of the research process in order to improve their capacities, knowledge, and agency and to ensure that the research is designed from their lived experiences.
Building on these research efforts, interventions may be designed that include individual counseling strategies as well as systemic interventions based on analyses of the communities in which young people are involved (for example, families and couples and not only individuals). In addition, we need more research to learn about the process of collective empowerment and critical consciousness development, which can inform youths' advocacy efforts and serve as a buffer in their career development ( Blustein, 2019 ).
6. Conclusion
The research ideas presented in this contribution have been offered as a means of stimulating needed scholarship, program development, and advocacy efforts. Naturally, these ideas are not intended to be exhaustive. We hope that readers will find ideas and perspectives in our essay that may stimulate a broad-based research agenda for our field, optimally informing transformative interventions and needed policy interventions for individuals and communities suffering from the loss of work (and loss of loved ones in this pandemic). A common thread in our essay is the recommendation that research efforts be constructed from the lived experiences of the individuals who are now out of work. As we have noted here, their experiences may not be similar to other periods of extensive unemployment, which argues strongly for experience-near, participatory research. We are also advocating for the use of rigorous quantitative methods to develop new understanding of the nature of unemployment during this period and to develop and assess interventions. In addition, we would like to advocate that the collective scholarly efforts of our community include incentives and outcomes that support unemployed individuals. For example, online workshops and resources can be shared with participants and other communities as a way of not just dignifying their participation, but of also providing tangible support during a crisis.
In closing, we are humbled by the stories that we hear from our communities about the job loss of this pandemic period. Our authorship team shares a deep commitment to research that matters; in this context, we believe that our work now matters more than we can imagine.
☆ The order of authorship for authors two through six was determined randomly; each of these authors contributed equally to this paper.
- Blustein D.L. Oxford University Press; NY: 2019. The importance of work in an age of uncertainty: The eroding work experience in America. [ Google Scholar ]
- Cinamon R.G. Paper presented at the Society of Vocational Psychology; Arizona: 2018, June. Life span and time perspective of the work-family interface – Critical transitions and suggested interventions. [ Google Scholar ]
- Cohen-Scali V., Pouyaud J., Podgorny M., Drabik-Podgorna V., Aisenson G., Bernaud J.L., Moumoula I.A., Guichard J., editors. Interventions in career design and education. Springer; Cham, Switzerland: 2018. [ Google Scholar ]
- Duffy R.D., Blustein D.L., Diemer M.A., Autin K.L. The psychology of working theory. Journal of Counseling Psychology. 2016; 63 (2):127–148. [ PubMed ] [ Google Scholar ]
- Evans D.K., Popova A. Cash transfers and temptation goods: A review of global evidence. The World Bank. 2014 doi: 10.1596/1813-9450-6886. [ CrossRef ] [ Google Scholar ]
- Ferreira J.A., Reitzle M., Lee B., Freitas R.A., Santos E.R., Alcoforado L., Vondracek F.W. Configurations of unemployment, reemployment, and psychological well-being: A longitudinal study of unemployed individuals in Portugal. Journal of Vocational Behavior. 2015; 91 :54–64. doi: 10.1016/j.jvb.2015.09.004. [ CrossRef ] [ Google Scholar ]
- French B.H., Lewis J.A., Mosley D.V., Adames H.Y., Chavez-Dueñas N.Y., Chen G.A., Neville H.A. Toward a psychological framework of radical healing in communities of color. The Counseling Psychologist. 2020; 48 :14–46. doi: 10.1177/0011000019843506. [ CrossRef ] [ Google Scholar ]
- International Labor Organization World Employment and Social Outlook – Trends. 2020:2020. https://www.ilo.org/global/research/global-reports/weso/2020/lang--en/index.htm [ Google Scholar ]
- International Labor Organization. (2020b). Young workers will be hit hard by COVID-19's economic fallout. https://iloblog.org/2020/04/15/young-workers-will-be-hit-hard-by-covid-19s-economic-fallout/ .
- Kalleberg A.L. Precarious work, insecure workers: Employment relations in transition. American Sociological Review. 2009; 74 (1):1–22. doi: 10.1177/000312240907400101. [ CrossRef ] [ Google Scholar ]
- Mosley D.V., Hargons C.N., Meiller C., Angyal B., Wheeler P., Davis C., Stevens-Watkins D. Critical consciousness of anti-Black racism: A practical model to prevent and resist racial trauma. Journal of Counseling Psychology. 2020 doi: 10.1037/cou0000430. (Advance online publication) [ PMC free article ] [ PubMed ] [ CrossRef ] [ Google Scholar ]
- Paul K.I., Moser K. Unemployment impairs mental health: Meta-analyses. Journal of Vocational Behavior. 2009; 74 :264–282. [ Google Scholar ]
- Pinker J. The Atlantic; 2020. The pandemic will cleave America in two. [ Google Scholar ]
- Wanberg C.R. The individual experience of unemployment. Annual Review of Psychology. 2012; 63 :369–396. [ PubMed ] [ Google Scholar ]
- - Google Chrome
Intended for healthcare professionals
- My email alerts
- BMA member login
- Username * Password * Forgot your log in details? Need to activate BMA Member Log In Log in via OpenAthens Log in via your institution
Search form
- Advanced search
- Search responses
- Search blogs
- News & Views
- Covid-19, unemployment...
Covid-19, unemployment, and health: time for deeper solutions?
Read our latest coverage of the coronavirus outbreak.
- Related content
- Peer review
- Martin Hensher , associate professor of health systems financing and organisation 1 2
- 1 Deakin Health Economics, Deakin University, 221 Burwood Highway, Burwood, VIC 3125, Australia
- 2 Menzies Institute for Medical Research, University of Tasmania
- Correspondence to: martin.hensher{at}deakin.edu.au
As covid-19 drives unemployment rates around the world to levels unseen in generations, once radical economic policy proposals are rapidly gaining a hearing. Martin Hensher examines how job guarantee or universal basic income schemes might support better health and better economics
Covid-19 has been a dramatic global health and economic shock. As SARS-CoV-2 spread across nations, economic activity plummeted, first as individuals changed their behaviour and then as government “lockdowns” took effect. 1 Macroeconomic forecasters foresee a major recession continuing through 2020 and into 2021. 2 Although the governments of many nations have taken novel steps to protect workers, unemployment has risen dramatically in many countries ( box 1 , fig 1 ); poverty and hunger are on the rise in low and middle income countries. 5 Covid-19 has directly caused illness and death at a large scale, and further threatens health through disruption of access to health services for other conditions.
Covid-19 and unemployment
Although unemployment soared in response to covid-19 in some nations, the policy measures undertaken by others have prevented many workers from becoming technically unemployed. In the United Kingdom, the headline rate of unemployment for April-June 2020 was 3.9%—only slightly higher than the 3.89% rate in April-June 2019. Yet in June 2020 9.3 million people were in the coronavirus job retention scheme (“furlough”) and another 2.7 million had claimed a self-employment income support scheme grant; there had been the largest ever decrease in weekly hours worked; 650 000 fewer workers were reported on payrolls in June than in March; and the benefit claimant count had more than doubled from 1.24 million to 2.63 million people. 3 The Australian Bureau of Statistics has produced an adjusted estimate of Australian unemployment that includes all those temporarily stood down or laid off, to allow a closer comparison with US and Canadian statistics ( fig 1 ). As emergency support measures are wound back, concern is growing that the downwards trend from the April peak might not be maintained in coming months.

Unemployment rates in Australia, Canada, and the United States from March to July 2020. 4
- Download figure
- Open in new tab
- Download powerpoint
The pandemic continues to spread, and hopes for a rapid “return to normal” look increasingly unfounded. The economic consequences of covid-19 have the potential to further damage human health if not managed effectively—even after the pandemic has faded. Even with the most rose tinted views of recovery, the effects of covid-19 on unemployment are likely to be substantial and long lived. Ambitious responses to the imminent scourge of mass unemployment are being discussed. Two such proposals—a job guarantee and universal basic income—might protect and promote health as well as prosperity. Governments around the world should consider radical plans to safeguard their citizens’ livelihoods and wellbeing.
Unemployment and health in the time of covid-19
Decades of accumulated evidence show a strong and consistent association between unemployment and a range of adverse health outcomes, including all cause mortality, death from cardiovascular disease and suicide, and higher rates of mental distress, substance abuse, depression, and anxiety. 6 7 8 Job insecurity is similarly associated with poorer self-assessed health status, mental distress, depression, and anxiety. 9 Unemployment and economic adversity are intimately related with despair and lack of hope, which have increasingly been linked with mortality and the rise and severity of the US opioid epidemic. 10 11 Whether recessions and mass unemployment increase aggregate mortality is less clear; historical studies indicated improvements in mortality during the Great Depression in the 1930s, 7 but more recent US research found that older workers (aged 45-66) who lose their jobs in a recession have higher mortality than those who lose their jobs in boom times. 12 Insecurity, precariousness, and austerity harmed both unemployed and employed people during the protracted economic crisis in Greece after 2008-09. 13 Meanwhile, differing welfare state institutions and unemployment insurance arrangements directly limit or amplify health inequalities in a society. 7 14
These factors could adversely affect the health of growing numbers of unemployed workers after covid-19. 15 16 Governments, business lobbyists, and civil society advocates around the world are debating how economies might best recover from the covid recession. Although governments currently acknowledge the need to spend freely during the crisis, experience suggests that pressure to pursue misguided austerity policies might grow, threatening subsequent recovery. Options on the table range from “green new deal” programmes to build a post-carbon economy and national industrial strategies to bring globalised manufacturing back onshore through to calls for reducing wages and labour protections to “free up” labour markets. Yet these are all indirect approaches to the effects of unemployment. Proposals for a job guarantee or a universal basic income seek to act more directly to support individual citizens.
The job guarantee
The idea of a right to employment can be traced back to the US New Deal in the 1930s, and to Article 23 of the 1948 United Nations Universal Declaration of Human Rights. More recently, in the contest for the Democratic Party’s 2020 candidate for US president, senators Bernie Sanders, Kirsten Gillibrand, and Cory Booker all included a job guarantee in their platforms, as did Alexandria Ocasio-Cortez’s green new deal resolution. More than one detailed proposal for a Federal Job Guarantee has been published in the US 17 18 and in Australia. 19 In one US proposal, 18 a federally funded public service employment programme would provide a standing offer of work at a living wage ($15 (£12; €13) an hour), along with key benefits including healthcare coverage. Employees of this programme would be deployed on a wide range of public works and community development activities, delivered through federal, state, local, and non-profit agencies. The proposal argues that this would effectively eliminate unwanted joblessness and underemployment and would rapidly force the private sector to increase wages to match this “living wage” alternative, lifting millions out of poverty and greatly improving the incomes of working poor people. 18 Proponents argue that the job guarantee is the most efficient “automatic stabiliser” for the economy throughout the business cycle, able to adjust up and down to reflect the changing economic health of the private sector. In economic downturns, it would provide guaranteed employment to stop people falling into poverty and losing “employability,” while also supporting aggregate demand to lift the economy out of recession. In boom times, workers will simply exit the programme for the private sector, as firms offer higher wages to secure the additional labour they need.
In the US, the job guarantee has been proposed as not only a key tool for recovery from covid-19, 20 but also a mechanism to ensure that this recovery breaks down historically entrenched racial inequalities in wealth. 21 Similarly, an emerging job guarantee proposal for Australia could rectify decades of welfare policy failures that have disproportionately affected indigenous Australians. 22 Proponents point to successful past or present international experiences with full or targeted employment guarantee programmes, including Argentina’s Plan Jefes, South Africa’s Expanded Public Works Programme, India’s National Rural Employment Guarantee Act, Belgium’s Youth Job Guarantee, the US Youth Incentive Entitlement Pilot Projects, and the UK’s Future Jobs Fund. 20
Universal basic income
Over the past few years, there has been a global explosion of interest in the concept of universal basic income. 23 24 25 Andrew Yang, another former contender for the 2020 Democrat presidential nomination, made universal basic income a central plank of his platform. Such proposals share key characteristics: they are a transfer of income (from the state to individuals) that is provided universally (to everyone, with no targeting), unconditionally (with no requirements, for example to work), and in cash (with no controls on what the money can be spent on). 25 Proposals also typically specify an income that is sufficiently generous that it can fully cover a basic level of living expenses. 23 Universal basic income is a direct means of reducing poverty, by ensuring that all in society receive enough to live with dignity; it could reduce income inequality; it could radically simplify current social welfare systems and remove poverty traps and disincentives to move from welfare into work; it could improve the ability of workers to refuse poorly paid, insecure, exploitative or unsafe jobs, through a reduced fear of loss of income; and it could be a buffer against technological unemployment, as automation and artificial intelligence replace human labour. 23 25 Universality is the key difference from today’s welfare systems; everyone should receive universal basic income as a right of citizenship, and its receipt by all should build the solidarity and legitimacy that will sustain this right. Universal basic income could improve health and reduce health inequities through direct action on various social determinants of health. 26 27 This variety of aims leads to the concept being simultaneously supported by those on the left as a radical, anti-capitalist policy, often viewed as an essential component of the ecological degrowth agenda, and by libertarian, tech capitalists as an efficient solution to the risk that ever expanding digital automation will destroy more jobs than it creates, and as a vital measure to help capitalism survive mass technological unemployment in the future. 28
In the wake of the covid-19 economic shock, universal basic income has been discussed as a potentially powerful policy solution to unprecedented economic dislocation. It has specifically been suggested as a tool for limiting the economic, social, and psychological trauma of covid-19. 29 The Spanish government has just introduced a nationwide, means tested minimum income programme (not universal) as a direct response to covid related unemployment. 30 The US government has made unconditional, one-off economic impact payments to most (but not all) American households. Near universal and unconditional universal basic income programmes have only operated at nationwide scale in two countries, Mongolia and Iran. The Mongolian programme has since ceased, and the Iranian programme is no longer strictly universal (the richest people are no longer eligible). Partial schemes and regional pilots, however, have been run successfully in a wide range of nations. 25 A recent trial that provided universal basic income to 2000 recipients in Finland found that employment outcomes, health, and wellbeing measures were better in the universal basic income group than in the comparison group, 31 and the Scottish government has been contemplating a three year trial of universal basic income in an experimental group of recipients. 32
Potential health benefits
Given the substantial evidence linking unemployment to poor health, proponents of both job guarantee and universal basic income schemes point to their potential health benefits as major arguments in their favour ( table 1 ). 20 26 These measures could be expected to positively affect health through four main pathways: direct effects for individual beneficiaries; knock-on effects improving labour market conditions for all workers; the macroeconomic and distributive benefits of more widespread prosperity; and more localised community effects unlocked by these programmes.
Health effects of job guarantee (JG) and universal basic income (UBI) programmes
- View inline
Multiple mechanisms would work through these four pathways to deliver potential health benefits, including reduced mortality and improved physical and mental health status. Key mechanisms include reducing poverty, improving economic security, improving the quality of jobs and work, and rebuilding stronger local communities. Unsurprisingly, pathways that link unemployment with poorer health will be more reliably affected by job guarantee programmes than by universal basic income. But universal basic income offers alternative pathways for better health through informal caring and non-market activities. Both types of programme could help resolve one of the problems that the covid-19 pandemic has brought into sharp focus—that low paid, insecure, and casualised workforces cannot afford to self-isolate or stay at home when sick or potentially infected because they lack access to paid sick leave. This problem has proved especially disastrous for those who care for elderly people.
Controversies and choices
Supporters of job guarantee or universal basic income programmes typically have different priorities and view them as two alternative options, not as complementary programmes that could co-exist. Most job guarantee proposals see it as not only a means to fight unemployment, but also an explicit instrument of macroeconomic policy 38 ; universal basic income would not function as an “automatic stabiliser” in the same way. Critics of job guarantee and universal basic income schemes primarily question their affordability and potential macroeconomic consequences ( box 2 ).
Economic controversies
Implementing a job guarantee or universal basic income programme would be a major economic reform in any nation and a decisive break with the economic orthodoxy that has prevailed since the Thatcher-Reagan revolution of the 1980s. It would undoubtedly be controversial. Most obviously, some would question them on cost and affordability grounds. A job guarantee programme would incur a substantial net cost to governments—modelling of proposed programmes indicates a net cost to the federal budget equivalent to 1.5% of annual general domestic product (GDP) in the US 18 and 2.6% in Australia (based on a net budgetary cost of A$51.7bn). 19 By comparison, the Australian government is spending A$70bn, or 3.6% of its GDP, on its emergency JobKeeper employment protection programme this year—budget costs of these magnitudes are not unheard of. The gross costs of a universal basic income programme would be substantially larger: income of $12 000 (close to the 2017 US poverty line) for every US adult would cost the federal budget about $3tn, or nearly 14% of GDP. 23 Yet this gross cost estimate is arguably misleading, 39 not only because universal basic income would be partially offset by large savings from current welfare programmes, but because so many recipients would return much or all of it in the form of tax payments. One estimate of the net cost of such a programme indicates that it could be as low as 2.95% of US GDP. 39 These proposals emerge as a growing number of economists are saying that the governments of countries in possession of their own sovereign currency can never “run out of money” and can always purchase whatever goods and services are for sale in the currency they issue. 38 40 They also suggest that inflation—the other risk often pointed to by critics of job guarantee or universal basic income—is currently highly unlikely, with a general fear that the covid-19 recession will prove to be deflationary rather than inflationary.
For those concerned with health, however, philosophical differences might be of more interest. Social determinants and socioeconomic inequalities are well understood to be powerful forces driving health outcomes at both individual and population levels. Universal basic income seeks to reduce poverty and inequality by putting in place an absolute floor—a minimum income provided to everyone in society. A job guarantee seeks to affect poverty by ensuring that anyone who wants to work can work, for a living wage in a decent job. But in so doing, a job guarantee also explicitly increases the relative power of workers, ensuring that a larger share of national income flows to labour, rather than to the owners of capital—potentially reducing some of the extreme inequalities in income and wealth distribution that have arisen over the past four decades. One criticism of universal basic income is that it might (whether inadvertently or by design) become a “plutocratic, philanthropic” programme 28 —scraps from the table of the ultra wealthy, which might cement dependence and powerlessness in a future of technological unemployment. Equally, a job guarantee might be criticised as being a mid 20th century solution to a 21st century problem, which will reinforce social hierarchies by insisting on participation in paid employment as the solution to poverty.
The unemployment triggered by covid-19 in so many countries is a clear and present danger to individual and population health. Tinkering around the margins of current welfare systems, exhortations for yet more labour market “flexibility,” or an unwillingness to maintain public spending through a potentially long and drawn out downturn all offer a fast track to poor outcomes. The scale of the covid economic shock demands more radical action. The substantial health harms of unemployment might be mitigated by a universal basic income programme, but if unemployment is the problem, then employment seems likely to deliver more effective mitigation along the many and complex pathways by which these harms are transmitted. If so, implementing national job guarantee programmes should be a more urgent priority for governments in the immediate aftermath of covid-19. A successful job guarantee scheme would avert the harms of unemployment, strengthen the position of ordinary working people, and deliver a more broadly distributed prosperity in the short to medium term. This would be a much better position from which to then debate and trial universal basic income, allowing it to be correctly framed as a strategic, long term solution to the changing future of work, rather than simply as a response to the current economic crisis.
Key messages
Covid-19 has triggered economic recession and unprecedented rapid rises in unemployment in many countries
Mass unemployment has the potential to cause grave harm to individual and population health if not effectively mitigated
The scale of the crisis means that radical solutions might need to be considered, such as a job guarantee or universal basic income programmes
These policies have the potential to protect human health and dignity, but would mark a significant break with economic orthodoxy
Acknowledgments
I acknowledge the Wurundjeri people of the Kulin Nation as the traditional owners of the land on which this work was undertaken.
Contributors and sources: MH has worked on health financing, planning, and economics as a senior policy maker and researcher in the UK, South Africa, and Australia and as a consultant for the World Bank, World Health Organization and the European Commission. His research on the ecological and economic sustainability of healthcare systems has included examining a number of emerging heterodox economic approaches, two of which are gaining in significance: ecological economics and modern monetary theory. Members of these schools have promoted universal basic income and a job guarantee, respectively, over many years. This article builds on the existing academic literature to consider very recent policy proposals that are emerging in response to the threat of mass unemployment in the wake of covid-19.
Patient involvement: No patients were involved.
Competing interests: I have read and understood BMJ policy on declaration of interests and have the following interests to declare: this research was supported by an Australian Government Research Training Scholarship.
- ↵ Goolsbee A, Syverson C. Fear, lockdown, and diversion: comparing drivers of pandemic economic decline 2020. National Bureau of Economic Research, June 2020. https://www.nber.org/papers/w27432
- ↵ International Monetary Fund. World economic outlook update: a crisis like no other, an uncertain recovery. June 2020. https://www.imf.org/en/Publications/WEO/Issues/2020/06/24/WEOUpdateJune2020
- ↵ Office for National Statistics. Labour market overview, UK: August 2020. 2020. https://www.ons.gov.uk/employmentandlabourmarket/peopleinwork/employmentandemployeetypes/bulletins/uklabourmarket/august2020
- ↵ Australian Bureau Statistics. Understanding unemployment and the loss of work during the covid-19 period: an Australian and international perspective. 13 August 2020. https://www.abs.gov.au/articles/understanding-unemployment-and-loss-work-during-covid-19-period-australian-and-international-perspective
- ↵ World Bank. World Bank Group. 100 countries get support in response to covid-19. 19 May 2020. https://www.worldbank.org/en/news/press-release/2020/05/19/world-bank-group-100-countries-get-support-in-response-to-covid-19-coronavirus
- Stuckler D ,
- von dem Knesebeck O
- Beckfield J
- Beckfield J ,
- Eikemo TA ,
- McNamara C ,
- Kugenthiran N ,
- Collins D ,
- Christensen H ,
- Fullwiler S ,
- Tcherneva P ,
- ↵ Mitchell WF, Watts M. Investing in a job guarantee for Australia. Centre of Full Employment and Equity. July 2020. http://www.fullemployment.net/publications/reports/2020/CofFEE_Research_Report_2000-02.pdf
- Tcherneva P
- Hamilton D ,
- Asanthe-Muhammad D ,
- Collins C ,
- ↵ Pearson N. The case for a government jobs guarantee. The Australian. 4 July 2020. https://www.theaustralian.com.au/commentary/the-case-for-a-government-jobs-guarantee/news-story/dee6e9545cd5af967c853e2f0481b02d
- Rothstein J
- Banerjee A ,
- Niehaus P ,
- Gentiline U ,
- Rigolini J ,
- Ruckert A ,
- Fouksman E ,
- Johnson MT ,
- Johnson EA ,
- ↵ Dombey D, Sandbu M. Spain to push through minimum income guarantee to fight poverty. Financial Times, London. 28 May 2020. https://www.ft.com/content/0b6a5d25-e078-4dfc-b314-f659b566317e
- ↵ Kangas O, Jauhiainen S, Simanainen M, Ylikännö M. Evaluation of the Finnish Basic Income Experiment/Suomen perustulokokeilun arviointi Helsinki: Ministry of Social Affairs and Health/Sosiaali- ja terveysministeriö; 2020. https://julkaisut.valtioneuvosto.fi/bitstream/handle/10024/162219/STM_2020_15_rap.pdf
- ↵ Paton C. Coronavirus in Scotland: Nicola Sturgeon eyes plans for universal basic income. The Times, London. 5 May 2020. https://www.thetimes.co.uk/article/nicola-sturgeon-eyes-plans-for-universal-basic-income-c9rhfwbx7
- Nagelhout GE ,
- de Goeij MCM ,
- de Vries H ,
- Kleinman R ,
- Fischer B ,
- Gardiner C ,
- Geldenhuys G ,
- Olanrewaju O ,
- Lafortune L
- Mitchell W ,
- Widerquist K
- Skidelsky R
What do you think? Leave a respectful comment.

Laura Santhanam Laura Santhanam
- Copy URL https://www.pbs.org/newshour/economy/3-charts-reveal-how-the-covid-19-unemployment-crisis-isnt-over
3 charts reveal how the COVID-19 unemployment crisis isn’t over
While some politicians have suggested the number of U.S. coronavirus cases has peaked, the prognosis for employment and the economy isn’t good, economists say.
More than 41 millions of Americans have filed for unemployment insurance since the spread of COVID-19, according to data the U.S. Department of Labor released Thursday. Those job losses show signs of slowing down, but the pandemic’s lingering long-term effects on the economy could play out for decades.
Federal data showed 2.1 million people had filed claims in one week.
That number suggests a possible slowdown in U.S. layoffs compared to recent weeks. In late March, more than 3.3 million Americans filed jobless claims , quadrupling a previous record. That number was quickly eclipsed with 4.4 million claims filed in one week by mid-April. But it “remains incredibly high,” said Stephanie Aaronson, an economist who is vice president and director of economic studies at the Brookings Institution.
Here are three ways to look at how the nation is losing jobs and if reopening could slow this unprecedented plunge.

Chart by Megan McGrew/PBS NewsHour
Job losses during the pandemic quickly dwarfed the Great Recession
“Two million claims a week is just hard to imagine,” said Aaronson, who previously served on the Federal Reserve Board. “The numbers of claims we’re seeing now are outside of historical experience.”
For perspective, she pointed to the rise in unemployment between 2007 and 2009 during the Great Recession. Since the pandemic started, the nation lost twice as many jobs in two months as it did during the entire Great Recession, Aaronson said.
In early April, 42 states had some kind of stay-at-home order in place, and jobless claims ballooned. Now, as more states move to allow businesses to reopen, the increase has slowed. But it’s still growing, suggesting that the kickstart for commerce after strict social distancing isn’t enough to get things back to normal.
And there could be “a second wave of layoffs,” said Till von Wachter, economist and professor at University of California at Los Angeles.
“Businesses that hit the ‘pause’ button may find that business is not as good as they had hoped” when they return, he said.
How long will jobless benefits last?
Before COVID-19 came into the picture, unemployment insurance varied greatly state to state. Capping out at 12 weeks, Florida’s was the shortest benefit. Massachusetts offers the longest time period that people can collect — up to 30 weeks — unless federal benefits or ample jobs are available. That means if you are covered through a federal program, or if you lose your job during a period of low unemployment when it’s conceivably easier to find a new job, Massachusetts doesn’t offer the full benefit period. Most states typically offer up to 26 weeks of benefits, according to the Center on Budget and Policy Priorities.
The CARES Act enabled all states to choose to offer 13 more weeks of benefits, called Pandemic Emergency Unemployment Assistance . Thirty states have accepted those benefits, which are funded by the federal government and expire on Dec. 31.

But there’s a lag in how many people have applied for unemployment insurance and how many people are actually getting it. So far, von Wachter said, roughly 20 million Americans have received unemployment insurance.
Right now, people in lower-wage jobs are more at risk of becoming unemployed, Friedman said. While federal legislation has buoyed people who’ve been left without work because of COVID-19, particularly in restaurants and health care (as a result of people steering clear of doctor’s offices for regular check-ups and elective procedures), von Wachter said there is concern that the supplemental money allotted is not enough to sustain them because rent and bills ate up a higher proportion of their wages than those with higher incomes. That capsized lower-wage workers’ ability to set aside savings and shore up resources that could have helped them during this economic downturn.
Younger generations already hit by COVID-19 Recession
But the cohort most affected by the pandemic-fueled economic crisis may be those who haven’t yet joined the labor market, said John Friedman, an economist and professor at Brown University.
“If you graduate into a bad economy, there’s a permanent impact” on earning potential and lost wages, Friedman said.

Already in California, younger generations of workers have been particularly hard-hit, according to an analysis of state jobless claims conducted by the California Policy Lab . In their study, a third of Generation Z workers and a quarter of Millennials have filed for unemployment insurance, compared to roughly one out of five Baby Boomers and Generation X workers.
Recessions are difficult for everyone, but especially so for high school graduates, von Wachter said. For many, he said, the recession unfolding now “will scar them” for the next decade of their lives. Among those in California who completed their high school education but did not graduate from college, the recent study shows half have applied for jobless benefits.
It is too soon to fully understand what the long-term effects of COVID-19 may hold for the U.S. economy, Friedman said. People are spending money differently with more online purchases and fewer things done in person, like eating out or getting a haircut, but it’s unclear if those changes are permanent. And even when the economy does rebound, and more people are back to work, Friedman said those shifts “may come at large personal costs.”
“People may find a job, but it’s at much lower pay than what they did before,” he said.
Laura Santhanam is the Health Reporter and Coordinating Producer for Polling for the PBS NewsHour, where she has also worked as the Data Producer. Follow @LauraSanthanam
Support Provided By: Learn more
Educate your inbox
Subscribe to Here’s the Deal, our politics newsletter for analysis you won’t find anywhere else.
Thank you. Please check your inbox to confirm.

The Pandemic's Impact on Unemployment and Labor Force Participation Trends
Following early 2020 responses to the pandemic, labor force participation declined dramatically and has remained below its 2019 level, whereas the unemployment rate recovered briskly. We estimate the trend of labor force participation and unemployment and find a substantial impact of the pandemic on estimates of trend. It turns out that levels of labor force participation and unemployment in 2021 were approaching their estimated trends. A return to 2019 levels would then represent a tight labor market, especially relative to long-run demographic trends that suggest further declines in the participation rate.
At the end of 2019, the labor market was hotter than it had been in years. Unemployment was at a historic low, and participation in the labor market was finally increasing after a prolonged decline. That tight labor market came to an abrupt halt with the COVID-19 pandemic in the spring of 2020.
Now, two years later, the labor market has mostly recovered from the depths of the pandemic recession. The unemployment rate is close to pre-pandemic lows, and job openings are at record highs. Yet, participation and employment rates have remained persistently below pre-pandemic levels. This suggests the possibility that the pandemic has permanently reduced participation in the economy and that current participation rates reflect a new normal. In this article, we explore how the pandemic has affected labor markets and whether a new normal is emerging.
What Is "Normal"?
One way to define the normal level of a variable is to estimate its trend and compare the observed data with the estimated trend values. Constructing a trend essentially means drawing a smooth line through the variations in the actual data.
But this means that constructing the trend for a point in time typically involves considering what happened both before and after that point in time. Thus, constructing the trend at the end of a sample is especially hard, since we do not yet know how the data will evolve.
We construct trends for three aggregate labor market ratios — the labor force participation (LFP) rate, the unemployment rate and the employment-population ratio (EPOP) — using methods described in our 2019 article " Projecting Unemployment and Demographic Trends ."
First, we estimate statistical models for LFP and unemployment rates of demographic groups defined by age, gender and education. For each gender and education, we decompose its unemployment and LFP into cyclical components common to all age groups and smooth local trends for age and cohort effects.
Second, we aggregate trends from the estimates of the group-specific trends. Specifically, we construct the trend for the aggregate LFP rate as the population-share-weighted sum of the corresponding estimated trends for demographic groups. We construct the aggregate unemployment rate and EPOP trends from the group-specific LFP and unemployment trends and the groups' population shares.
In our previous work, we estimated the trends for the unemployment rate and LFP rate of a gender-education group separately using maximum likelihood methods. The estimates reported in this article are based on the joint estimation of LFP and unemployment rate trends using Bayesian methods.
We separately estimate the trends using data from 1976 to 2019 (pre-pandemic) and from 1976 to 2021 (including the pandemic period). Figures 1, 2 and 3 display annual averages for the three aggregate labor market ratios — the LFP rate, the unemployment rate and EPOP, respectively — from 1976 to 2021.

In each figure, the solid black line denotes the observed values, and the blue and pink lines denote the estimated trend using data from 1976 up to and including 2019 and 2021, respectively. The estimated trends are subject to uncertainty, and the plotted trends represent the median estimate of the trend.
For the estimates based on data up to 2021, we also include the 90 percent coverage area shown as the shaded pink area. According to the statistical model, there is a 90 percent probability that the trend is contained in the coverage area. The blue and pink dotted lines represent our projections on how the labor market ratios will evolve until 2031, again based on the estimated trend up to and including 2019 and 2021. The shaded gray vertical areas highlight recessions as defined by the National Bureau of Economic Research (NBER).
Pre-Pandemic Trends: 1976-2019
We start with the pre-pandemic trends for the LFP rate and unemployment rate estimated for data from 1976 through 2019. After a long recovery from the 2007-09 recession, the LFP rate was 63.1 percent in 2019 (slightly above the estimated trend value of 62.8 percent), and the unemployment rate was 3.7 percent (noticeably below its estimated trend value of 4.7 percent).
The LFP rate being above trend and the unemployment rate being below trend reflects the characterization of the 2019 labor market as "hot." But note that even though the LFP rate exceeded its trend value in 2019, it was still lower than during the 2007-09 period. This difference is accounted for by the declining trend in the LFP rate.
As noted in our 2019 article , LFP rates and unemployment rates differ systematically across demographic groups. Participation rates tend to be higher for younger, more-educated workers and for men. Unemployment rates tend to be lower for men and for the older and more-educated population.
Thus, changes in the population composition over time — that is, the relative size of demographic groups — will affect the aggregate LFP and unemployment rates, in addition to changes in the LFP and unemployment rate trends of the demographic groups.
As also noted in our 2019 article, the hump-shaped trend of the aggregate LFP rate reflects a variety of forces:
- Prior to 1990, the aggregate LFP rate was boosted by an upward trend in the LFP rate of women. But after 1990, the LFP rate of women began declining. Combining this with declining trend LFP rates for other demographic groups has reduced the aggregate LFP rate.
- Changes in the age distribution had a limited impact prior to 2005, but the aging population since then has lowered the aggregate LFP rate substantially.
- Increasing educational attainment has contributed positively to aggregate LFP throughout the period.
The steady decline of the unemployment rate trend reflects mostly the contributions from an older and more-educated population and, to some extent, a decline in the trend unemployment rates of demographic groups.
Pre-Pandemic Expectations of Future LFP and Unemployment Trends
Our statistical model of smooth local trends for the LFP and unemployment rates of demographic groups has the property that the best forecast for future trend values of demographic groups is their last estimated trend value. Thus, the model will only predict a change in the trend of aggregate ratios if the population shares of its constituent groups are changing.
We combine the U.S. Census Bureau population forecasts for the gender-age groups with an estimated statistical model of education shares for gender-age groups to forecast population shares of our demographic groups from 2020 to 2031 (the dotted blue lines in Figures 1 and 2).
As we can see, the changing demographics alone imply further reductions of 1 percentage point and 0.2 percentage points in the trend LFP rate and unemployment rate, respectively. This projection is driven by the forecasted aging of the population, which is only partially offset by the forecasted higher educational attainment.
Based on data up to 2019, the same aggregate LFP rates in 2021 as in 2019 would have represented a substantial cyclical deviation upward from the pre-pandemic trends.
It is notable that the unemployment rate is much more volatile relative to its trend than the LFP rate is. In other words, cyclical deviations from trend are much more pronounced for the unemployment rate than for the LFP rate.
In fact, in our estimation, the behavior of the unemployment rate determines the common cyclical component of both the unemployment rate and the LFP rate. Whereas the unemployment rate spikes in recessions, the LFP rate response is more muted and tends to lag recessions. This feature will be important for interpreting how the estimated trend LFP rate changed with the pandemic.
Finally, Figure 3 combines the information from the LFP rate and unemployment rate and plots actual and trend rates for EPOP. On the one hand, given the relatively small trend decline of the unemployment rate, the trend for EPOP mainly reflects the trend for the LFP rate and inherits its hump-shaped path and the projected decline over the next 10 years. On the other hand, EPOP inherits the volatility from the unemployment rate. In 2019, EPOP is notably above trend, by about 1 percentage point.
Unemployment and Labor Force Participation During the Pandemic
The behavior of unemployment resulting from the pandemic-induced recession was different from past recessions:
- The entire increase in unemployment between February and April 2020 was accounted for by the increase in unemployment from temporary layoffs. This differed from previous recessions, when a spike in permanent layoffs led the bulge of unemployment in the trough.
- The recovery started in May 2020, and the speed of recovery was also much faster than in previous recessions. After only seven months, unemployment declined by 8 percentage points.
- The behavior of the unemployment rate is reflected in the 2020 recession being the shortest NBER recession on record: It lasted for two months (March to April 2020).
To summarize, the runup and decline of the unemployment rate during the pandemic were unusually rapid, but the qualitative features were not that different from previous recessions after properly accounting for temporary layoffs, as noted in the 2020 working paper " The Unemployed With Jobs and Without Jobs . "
The decline in the LFP rate was sharp and persistent. The LFP rate dropped from 63.4 percent in February 2020 to 60.2 percent in April 2020, an unprecedented drop during such a short period of time. After a rebound to 61.7 percent in August 2020, the LFP rate essentially moved sideways and remained below 62 percent until the end of 2021.
The large drop in the aggregate LFP rate has been attributed to, among others:
- More people — especially women — leaving the labor force to care for children because of school closings or to care for relatives at increased health risk, as noted in the 2021 work " Assessing Five Statements About the Economic Impact of COVID-19 on Women (PDF) " and the 2021 article " Caregiving for Children and Parental Labor Force Participation During the Pandemic "
- An increase in retirement due to health concerns, as noted in the 2021 working paper " How Has COVID-19 Affected the Labor Force Participation of Older Workers? "
- Generous pandemic income transfers and unemployment insurance programs, as noted in the 2021 article " COVID Transfers Dampening Employment Growth, but Not Necessarily a Bad Thing "
All of these factors might impact the participation trend, but by how much?
The Pandemic's Effect on Trend Estimates for LFP and Unemployment
The aggregate trend assessment for the LFP and unemployment rates has changed considerably as a result of 2020 and 2021. Repeating the estimation of trend and cycle for our demographic groups using data from 1976 up to 2021 yields the pink trend lines in Figures 1 and 2.
The updated trend estimates now put the positive cyclical gap in 2019 for LFP at 0.5 percentage points (rather than 0.3 percentage points) and the negative cyclical gap for the unemployment rate at 1.4 percentage points (rather than 1 percentage point). That is, by this estimate of the trend, the labor market in 2019 was even hotter than by the estimates from the 1976-2019 period.
In 2021, the actual LFP rate is essentially at trend, and the unemployment rate is only slightly above trend. That is, by this estimate of the trend, the labor market is relatively tight.
Notice that even though the new 2021 trend estimates for both the LFP and the unemployment rates differ noticeably from the trend values predicted for 2021 based on data up to 2019, the trend revisions for the LFP rate are limited to more recent years, whereas the trend revisions for the unemployment rate apply to the whole sample.
The difference in revisions is related to how confident we can be about the estimated trends. The 90 percent coverage area is quite narrow for the LFP rate for the entire sample up to the last four years. Thus, there is no need to drastically revise the estimated trend prior to 2017.
On the other hand, the 90 percent coverage area for the trend unemployment rate is quite broad throughout the sample. That is, a wide range of values for trend unemployment is potentially consistent with observed unemployment values. Consequently, the last two observations lead to a wholesale reassessment of the level of the trend unemployment rate.
Another way to frame the 2020-21 trend revisions is as follows. The unemployment rate is very cyclical, deviations from trend are large, and though the sharp increase and decline of the unemployment rate in 2020-21 is unusual, an upward level shift of the trend unemployment rate best reflects the additional pandemic data.
The LFP rate, however, is usually not very cyclical, and it is only weakly related to the unemployment rate. Since the model assumes that the cyclical response does not change over the sample, it then attributes the large 2020-21 drop of the LFP rate to a decline in its trend and ultimately to a decline of the trend LFP rates of most demographic groups.
Finally, the EPOP trend is again mainly determined by the LFP trend, seen in Figure 3. Including the pandemic years noticeably lowers the estimated trend for the years from 2017 onwards. The cyclical gap in 2019 is now estimated to be 1.4 percentage points, and 2021 EPOP is close to its estimated trend.
What Does the Future Hold?
In our framework, current estimates of trend LFP and the unemployment rate for demographic groups are the best forecasts of future rates. Combined with projected demographic changes, this implies a continued noticeable downward trend for the LFP rate and a slight downward trend for the unemployment rate.
The trend unemployment rate is low, independent of how we estimate the trend. But given the highly unusual circumstances of the pandemic, the model may well overstate the decline in the trend LFP rate. Therefore, it is likely that the "true" trend lies somewhere between the trends estimated using data up to 2019 and data up to 2021.
That being a possibility, it remains that labor markets as of now have been unusually tight by most other measures, such as nominal wage growth and posted job openings relative to hires. This suggests that the true trend is closer to the revised 2021 trend than to the 2019 trend. In other words, the LFP rate and unemployment rate at the end of 2021 relative to the 2021 estimate of trend LFP and unemployment rate are consistent with a tight labor market.
Andreas Hornstein is a senior advisor in the Research Department at the Federal Reserve Bank of Richmond. Marianna Kudlyak is a research advisor in the Research Department at the Federal Reserve Bank of San Francisco.
To cite this Economic Brief, please use the following format: Hornstein, Andreas; and Kudlyak, Marianna. (April 2022) "The Pandemic's Impact on Unemployment and Labor Force Participation Trends." Federal Reserve Bank of Richmond Economic Brief , No. 22-12.
This article may be photocopied or reprinted in its entirety. Please credit the authors, source, and the Federal Reserve Bank of Richmond and include the italicized statement below.
V iews expressed in this article are those of the authors and not necessarily those of the Federal Reserve Bank of Richmond or the Federal Reserve System.
Subscribe to Economic Brief
Receive a notification when Economic Brief is posted online.
By submitting this form you agree to the Bank's Terms & Conditions and Privacy Notice.
Thank you for signing up!
As a new subscriber, you will need to confirm your request to receive email notifications from the Richmond Fed. Please click the confirm subscription link in the email to activate your request.
If you do not receive a confirmation email, check your junk or spam folder as the email may have been diverted.
Phone Icon Contact Us
IMAGES
VIDEO
COMMENTS
Write an essay on unemployment due to COVID-19 in 150 words - 49893772. rohitkumar22218 rohitkumar22218 31.01.2022 English Secondary School answered Write an essay on unemployment due to COVID-19 in 150 words See answer Advertisement
Write an essay on unemployment due to covid 19 See answer Advertisement Advertisement vanit8590 vanit8590 Answer: hope it will help you. Explanation: Subscribe channel. GULZAAR CHHANNIWALA. Advertisement Advertisement ... Brainly.in. PL: Brainly.pl ...
The COVID-19 crisis has put unemployment insurance at center stage of American politics and economic policy. It has provided a lifeline for tens of millions of workers who have lost their jobs since the pandemic's onset six months ago, while at the same time exposing the system's vulnerabilities.
Here are five facts about how the COVID-19 downturn is affecting unemployment among American workers. The unemployment rate for women in May (14.3%) was higher than the unemployment rate for men (11.9%). This stands in contrast to the Great Recession, when the unemployment rate for women had peaked at 9.4% in July 2010 compared with a peak of ...
Nearly 17 million people filed initial claims for unemployment insurance over the past three weeks, suggesting that the unemployment rate is already above 15 percent [1] —well above the rate at ...
The COVID-19 pandemic has upended the U.S. labor market, with massive job losses and a spike in unemployment to its highest level since the Great Depression. How long unemployment will remain at crisis levels is highly uncertain and will depend on the speed and success of coronavirus containment measures. Historical patterns of monthly flows in and out of unemployment, adjusted for unique ...
By Kristie M. Engemann. Social distancing and the partial economic shutdown in response to the COVID-19 pandemic have had a profound impact on the U.S. economy, including on people's jobs and livelihoods. The overall immediate effects on the labor market have been easy to see: The unemployment rate shot up in the early months of the COVID-19 ...
In the pandemic unemployment graph, the time period is January 2020 to September 2020. The whole is the total number of unemployed plus people who are not in the labor force but want a job. The ...
Shown are pre-COVID-19 unemployment rates as of August 2019 (Fig. 2 a), followed by May 2020 (Fig. 2 b) where even the lowest levels of unemployment exceed the highest rates of the pre-pandemic period even in wealthy counties around Nashville (seen in the legend entries), August 2020 (Fig. 2 c), and September 2020 (Fig. 2 d). The overall ...
Abstract. This essay represents the collective vision of a group of scholars in vocational psychology who have sought to develop a research agenda in response to the massive global unemployment crisis that has been evoked by the COVID-19 pandemic. The research agenda includes exploring how this unemployment crisis may differ from previous ...
As covid-19 drives unemployment rates around the world to levels unseen in generations, once radical economic policy proposals are rapidly gaining a hearing. Martin Hensher examines how job guarantee or universal basic income schemes might support better health and better economics Covid-19 has been a dramatic global health and economic shock. As SARS-CoV-2 spread across nations, economic ...
More than 41 millions of Americans have filed for unemployment insurance since the spread of COVID-19, according to data the U.S. Department of Labor released Thursday. Those job losses show signs ...
Essay on unemployment due to COVID 19 in India - 52714551. tushar964 tushar964 30.06.2022 History Secondary School answered Essay on unemployment due to COVID 19 in India See answer Advertisement
This note provides evidence on the importance of local action to help address the short-term and long-term consequences of the coronavirus (COVID-19) outbreak. It estimates that the share of jobs potentially at risk during confinement ranges from 15% to 35% across regions within 30 OECD and 4 non-OECD European countries. It explains why the local role is essential for the recovery, and ...
at-home orders implemented in response to the COVID-19 pandemic and other pandemic-related factors affecting U.S. demand.5 States and localities implemented these 6orders to mitigate the risks of COVID-19 after it was declared a pandemic disease by the World Health Organization on March 11, 2020.7
The Effect of Lockdown Measures on Unemployment. Unemployment increased sharply in all regions of the United States as a result of the public health response to the COVID-19 pandemic. But in some states the unemployment rate increased by fewer than 5 percentage points between February and June, while in others the rate increased more than 10 ...
*write an essay on unemployment problem faced by people due covid 19* Get the answers you need, now! mubaraka68 mubaraka68 29.06.2021 English Secondary School answered ... Get the Brainly App Download iOS App Download Android App Brainly.in. PL: ...
April 2022, No. 22-12. Following early 2020 responses to the pandemic, labor force participation declined dramatically and has remained below its 2019 level, whereas the unemployment rate recovered briskly. We estimate the trend of labor force participation and unemployment and find a substantial impact of the pandemic on estimates of trend.